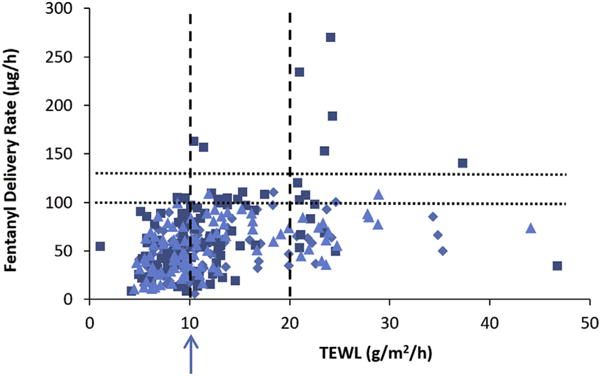
Fig. 3.

Fentanyl delivery rate (flux × area of TDS product) in skin permeation experiment vs. TEWL in skin integrity test before the experiment. Symbols: Alza TDS (squares), Mylan TDS (diamonds), Aveva TDS (triangles). Linear least squares regression equations: Alza: y = 2.8x + 33, r2 = 0.185; Aveva: y = 1.6x + 34, r2 = 0.213; Mylan: y = 1.4x + 32, r2 = 0.162; combined: y = 2.0x + 33, r2 = 0.158. The dotted lines indicate 100 and 130 μg/h values. The dashed lines indicate 10 and 20 g/m2/h values. The arrow indicates the TEWL value required to remove skin samples with > 130 μg/h.
