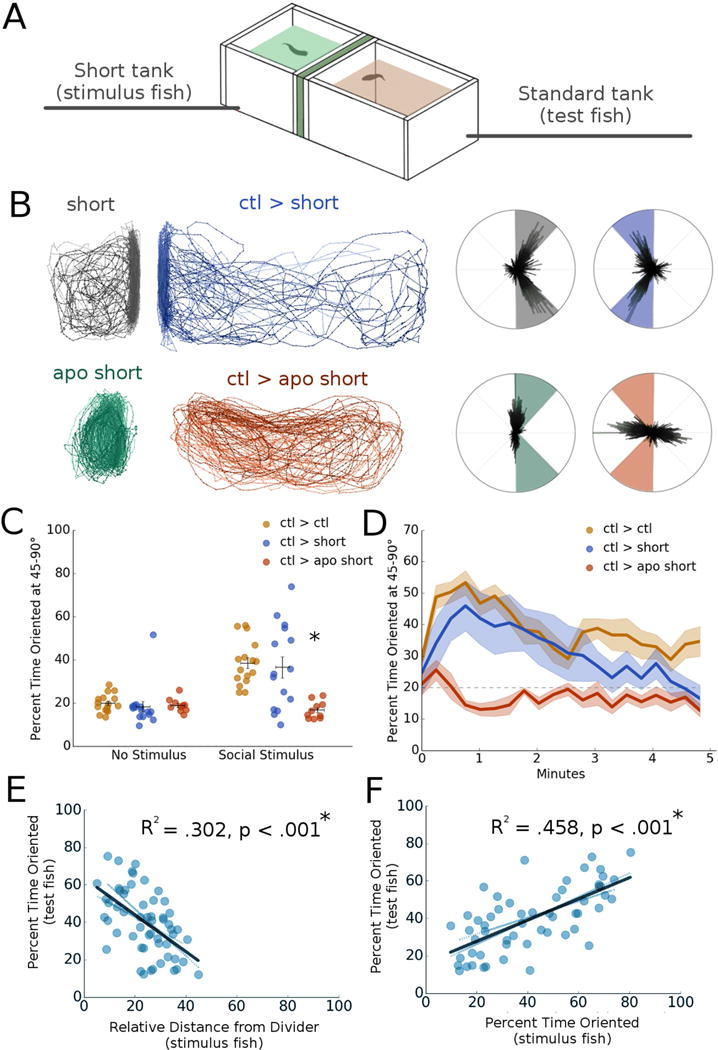
Fig 2. Behavioral feedback drives social orienting within a zebrafish dyad.

A. Schematic of short tank dyad assay apparatus, where the stimulus fish’s tank is truncated to half size to restrict movement away from the divider.
B. Representative traces and polar histograms of control fish (ctl > short) and fish exposed to a sub-optimal social stimulus (ctl > apo short). Test fish exposed to a sub-optimal stimulus had significantly suppressed orienting behavior relative to controls (*p = .009, n = 26).
C. Average percent time oriented at 45-90° for shor t tank experiments before (no stimulus) and after (social stimulus) social stimulus presentation. *p < .05, repeated measures mixed model ANOVA with post-hoc simple effects tests. Horizontal bars: mean, vertical bars: +/− s.e.m.
D. Percent time oriented over 5 minute period for short tank experiments.
E. Correlation plot between the test fish’s percent time oriented and the stimulus fish’s relative distance from the divider (R2 = .302, *p < .001, n = 112). *p < .05, linear regression.
F. Correlation plot between the test fish’s percent time oriented and the stimulus fish’s percent time oriented (R2 = .458, p < .001, n = 112) *p < .05, linear regression.
See also Figure S2.
