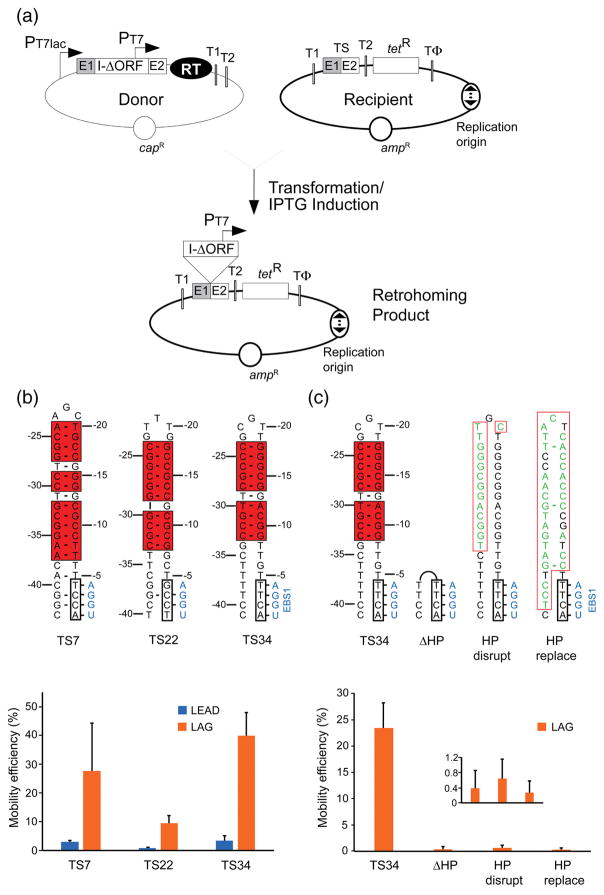
Fig. 4.
In vivo intron mobility assay and requirement of the 5′-exon hairpin structure for retrohoming. (a) Schematic of the assay showing donor and recipient plasmids and the retrohoming product. Two different versions of the recipient plasmid with the replication origin in either orientation (indicated by a bidirectional arrow) relative to the GsI-IIC target site (TS; ligated E1-E2 sequence) were used in the experiments. The two orientations are denoted LEAD or LAG depending on whether nascent leading or lagging strand DNAs could used as primers for reverse transcription of GsI-IIC. PT7, phage T7 RNA polymerase promoter; T1 and T2, E. coli rrnB T1 and T2 transcription terminators; TΦ, phage T7 Φ terminator. (b) Mobility assays with recipient plasmids containing target sites derived from three different GsI-IIC insertion sites in the G. stearothermophilus genome (TS7, TS22, and TS34 5′ exons with TS12 3′ exons, denoted TS7, TS22, and TS34, respectively). Nucleotide residues that can base pair to form the 5′-exon hairpin are boxed and highlighted by red shading, and the IBS1 sequence is boxed. The complementary EBS1 sequence in the intron is shown in blue. Base pairs are indicated by dashes. rG•dT and rU•dG are considered valid base pairs in the EBS/IBS pairings, and in some sequence contexts dG•dT pairs can form weak wobble pairs [41,64]. The bar graphs below show the mobility efficiency of the three target sites cloned in either the LEAD (blue) or LAG (orange) recipient plasmids. (c) Mobility assays of the wild-type and mutant TS34 target sites in which the 5′-exon hairpin was deleted, disrupted, or replaced. Nucleotides that differ from the TS34 target site are shown in green. Other features of the target sites are depicted as in panel (b). The bar graph below shows the mobility efficiencies (measured by the ratio of (TetR + AmpR)/AmpR) colonies) of the wild-type TS34 and mutant target sites cloned in the LAG recipient plasmid and assayed in parallel. The inset in the plot at the bottom right shows an expanded scale for mutants that have very low mobility efficiencies. In both (b) an (c), the bar shows the mean for three experiments with the error bar indicating the standard deviation.

