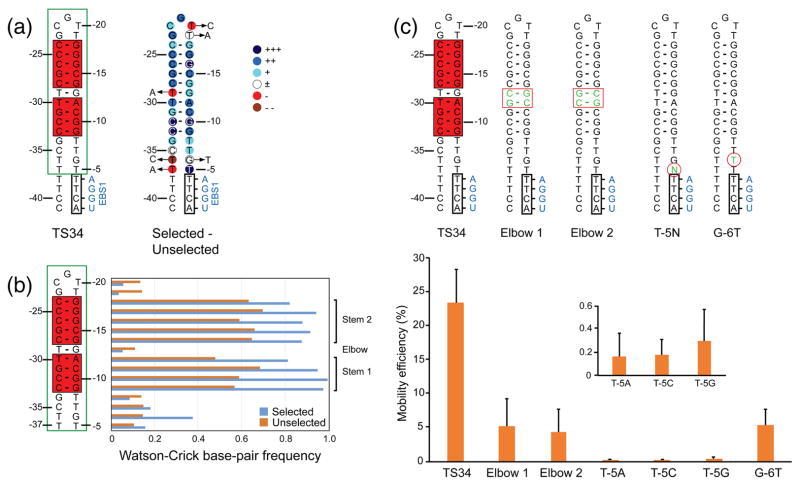
Fig. 6.
In vivo selection of 5′-exon sequences required for GsI-IIC retrohoming. (a) Sequence and predicted secondary structure of the TS34 5′ exon and degree of selection at different nucleotide positions. The 5′-exon structure is shown to the left, with Watson-Crick base-paired region of the hairpin highlighted in a red box and the region partially randomized for the selection enclosed in a green box. The degree of selection at each nucleotide is shown via color code on the hairpin to the right: +++, nucleotides present in >99% of selected sequences; ++, remaining nucleotides present at >15% higher frequency in selected than in the unselected sequences; +, remaining nucleotides present at >5–14% higher frequency in the selected than in unselected sequences; ±, nucleotide present at similar frequencies (±4%) in selected and unselected sequences; -, nucleotide present at 5–14% lower frequency in selected than in unselected sequences; --, nucleotide present at >15% lower frequency in selected than unselected sequences. Arrows pointing to circled letters indicate nucleotides that are found >2-fold more frequently after selection. (b) Selection for or against base pairing within the hairpin and flanking regions. The horizontal bar graphs (right) show the frequency of Watson-Crick base pairs at each position in the 5′-exon hairpin in the selected and unselected sequences (blue and red, respectively). Brackets on the far right delineate the upper and lower stems in which Watson-Crick base pairing is selected for in active target sites, and the TG elbow in which Watson-Crick base pairing is selected against. (c) Intron mobility assays with mutant DNA target sites. The top shows 5′-exon sequences of wild-type TS34 and mutant target sites depicted schematically as in panel (a). Mutations are shown as green nucleotides within red boxes or circles. The bar graphs below show mobility efficiencies for wild-type and mutant target sites in the LAG recipient plasmid, with the inset showing an expanded y-axis for the T-5 mutants, which have very low mobility efficiencies. The data are the mean for three independent experiments with the error bars indicating the standard deviation.

