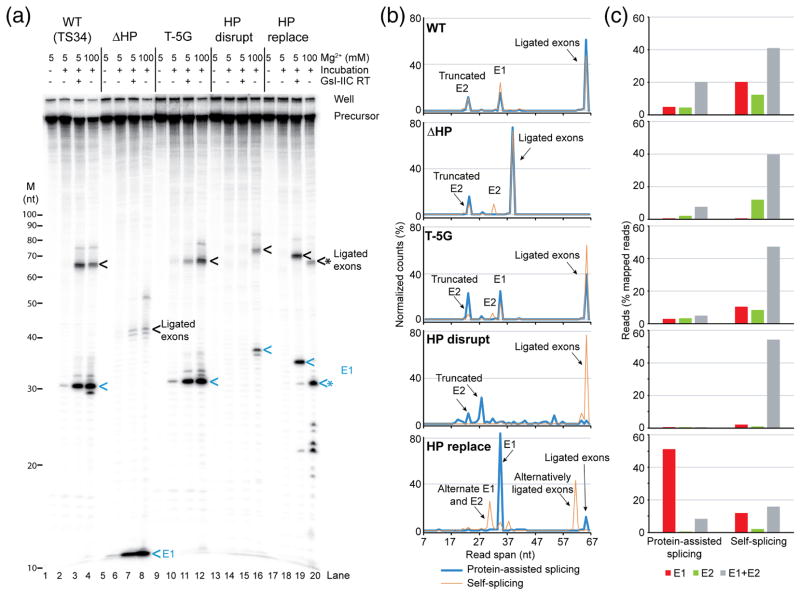
Fig. 9.
Splicing of wild-type and 5′-exon mutant GsI-IIC and high-throughput sequencing of reaction products. (a) Splicing reactions were done as described in Fig. 7 using 5′ 32P end-labeled precursor RNAs, and the reaction products were analyzed in a denaturing 12% polyacrylamide gel, which was dried and scanned with a Phosphorimager. The positions of RNA size markers (M, Decade RNA ladder; Thermo Fisher) are shown on the left, and major splicing products are labeled on the right. Ligated exons and 5′ exon (E1) are indicated by black and blue arrows, respectively. * indicates cleaved or mis-spliced RNAs. (b) Read spans of RNA splicing products determined from concordant paired-end sequences that mapped to 5′ exon, 3′ exon, or ligated exons (including alternative ligated exons). The plots show the percent (%) of the normalized reads of different read spans that mapped to exons for wild-type and each mutant. The alternatively spliced ligated exons and free 5′ exon (lane 20 in panel a) have a good match to IBS1/3 around the cleavage site (5′-tCCT|T, where “|” indicates the intron insertion site and upper case letters indicate base pairing to EBS1/3). The 5′-truncated E2 is not a prominent band in the gels and has poor matches to IBS1/3 at the cleavage sites (5′-tgCc|T or 5′tTTa|T). (c) Bar graph showing the percentage of 5′ exon, 3′ exon, or ligated exons (including alternative ligated exons) in mapped paired-end reads for wild-type and each mutant. The 7-nt E1 from the ΔHP construct is too short for the sequence to be mapped unequivocally and is not included in the analysis shown in panels (b) and (c).

