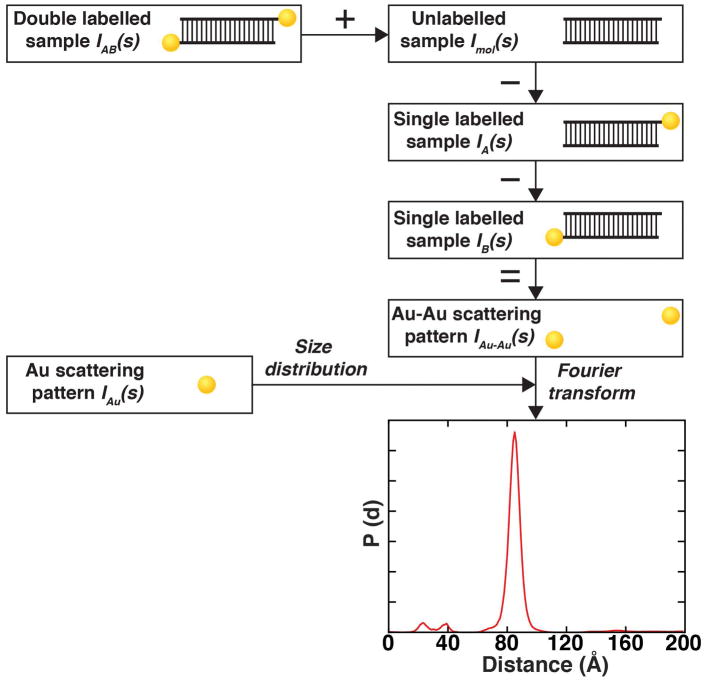
Figure 1. Schematic of AuSAXS workflow to determine gold label-gold label distance distributions.
Scattering intensity equation for a single-labeled molecule. The scattering signal can be decomposed into a sum of the individual scattering contributions: double-labeled sample, the macromolecule only, two gold-macromolecule cross-terms, and the interference from the gold labels. Schematic of the workflow to determine the Au-Au distance distribution. The SAXS profiles of the shown samples are used to extract the gold-gold interference scattering profile. The interference pattern is Fourier transformed into a distance distribution using basic profiles generated with the size distribution of Au nanocrystals.

