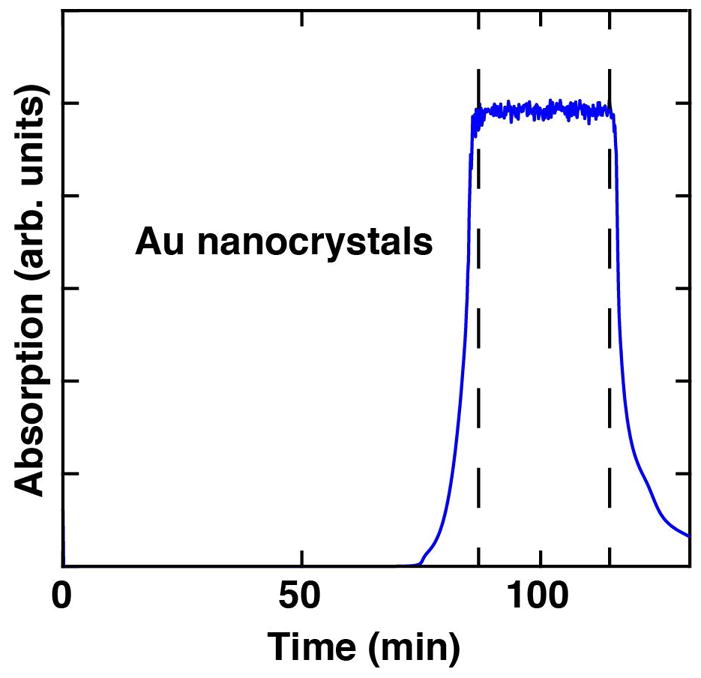
Figure 3. A sample FPLC chromatogram of Au nanocrystal size exclusion.

The absorption of the Au nanocrystals (blue) is monitored at 260 nm. The sample between the two dashed lines can be used for a highly uniform particle size distribution.

The absorption of the Au nanocrystals (blue) is monitored at 260 nm. The sample between the two dashed lines can be used for a highly uniform particle size distribution.