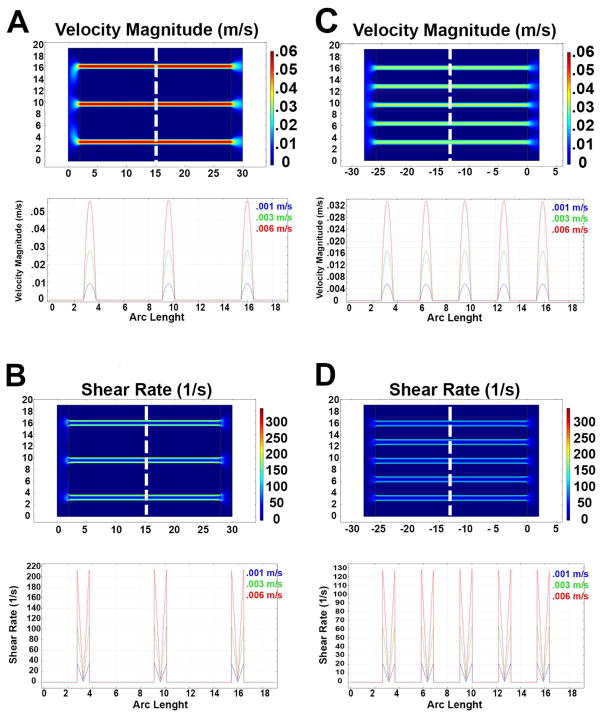
Fig. 5.
Flow velocity representation of the 7 and 13 channels scaffolds at 3 different flow input velocities (A–C respectively); the top panel shows the flow velocity distribution in the bioreactor’s cross section at a flow input of 0.006 m/s. Flow direction left to right. The bottom panels show the flow velocity profile calculated at a fixed distance from the inlet (dashed line) at 3 different flow input velocities. Shear rate representation of the 7 and 13 channels scaffolds at 3 different flow input velocities (B–D respectively). The top panel shows the flow velocity distribution in the bioreactor’s cross section at a flow input of 0.006 m/s. The bottom panels show the shear rate profile calculated at a fixed distance from the inlet (dashed line) at 3 different flow input velocities.

