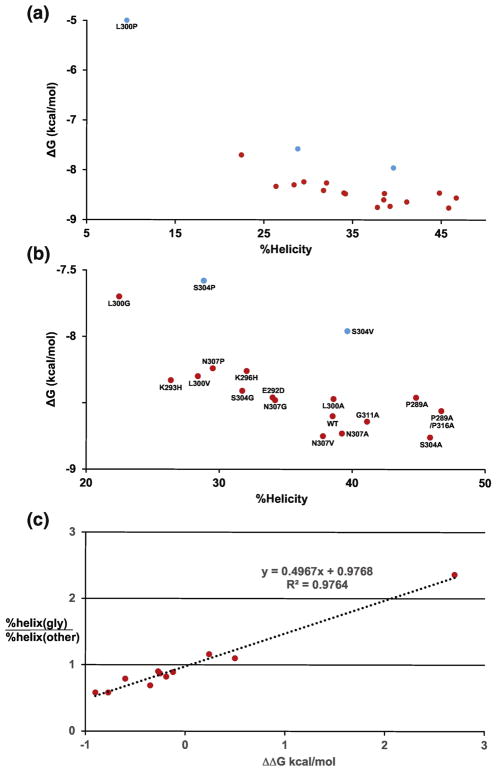
Figure 10. Linking binding free energy (ΔG) and helical stability of WT and mutant c-Myb peptides.
A) Plot of binding free energy (ΔG) from ITC is versus percent helicity values for residues 289–316. B) Expanded version of A with labels for each data point. Blue points show mutants that may change the structure of the c-Myb/KIX complex. C) Plot of helical stability versus ΔΔG of binding. The ΔG of binding for the glycine mutants was subtracted from the values of WT and the A, V, and P mutants at each site. Helical stability is plotted a percent helicity of a glycine mutant at a given position divided by the percent helicity of the WT and the A, V, and P mutants at the same site. The S304V mutant was excluded from the plot.

