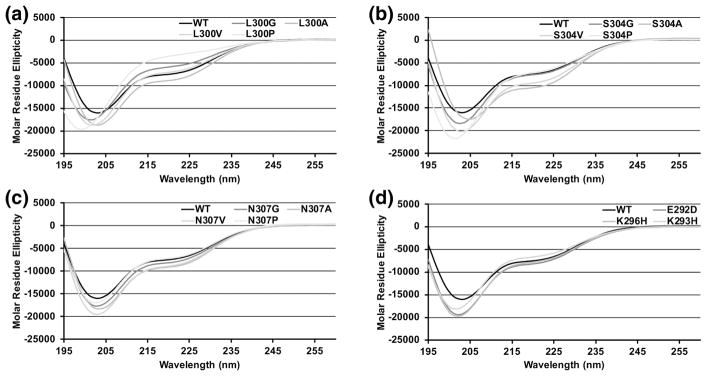
Figure 5. CD spectra of L300, S304, N307 and charge mutants.
Molar residue ellipticity is plotted against wavelength. In each panel the black curve shows the molar residue ellipticity of WT c-Myb TAD and grey curves show the mutants. A) CD spectra for L300 mutants. B) CD spectra for S304 mutants. C) CD spectra for N307 mutants. D) CD spectra for charge mutants. Molar residue ellipticity values in the figure are the mean of two CD measurements collected using the same sample.

