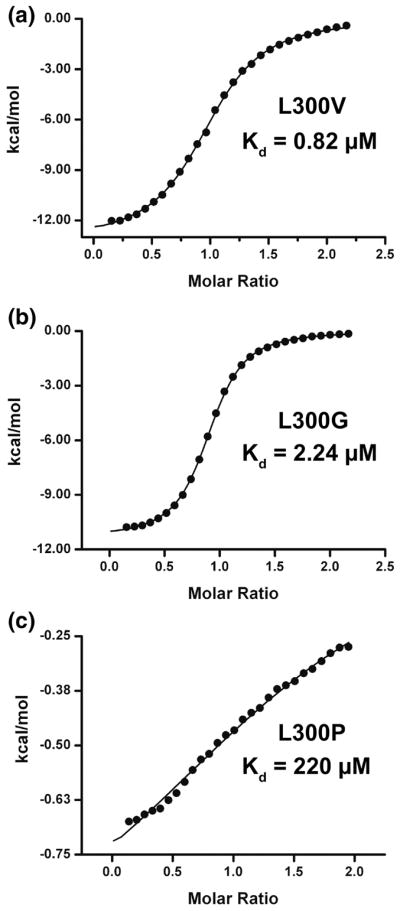
Figure 6. Measuring L300 mutants binding to KIX.

Black circles show enthalpy per mole of injectant, measured using isothermal titration calorimetry, plotted as a function of [c-Myb TAD]/[KIX]. Black lines show the fit to the data obtained using a single site binding model. Shown here is the binding of a) L300V to KIX b) L300G to KIX and C) L300P to KIX.
