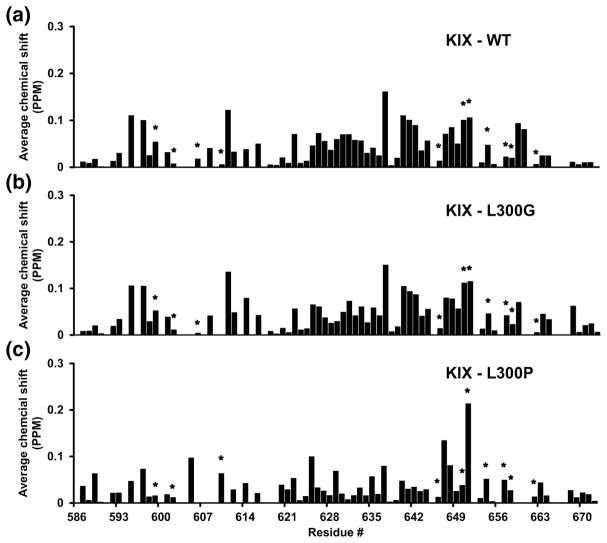
Figure 8. Chemical shift mapping of KIX binding to c-Myb TAD.
Calculation of average amide nitrogen and proton chemical shift changes for KIX is described in the materials and methods. The plots show residue specific chemical shift changes of A) KIX binding to WT cMyb TAD and B) KIX binding to L300G and C) KIX binding to L300P. Asterisks label KIX residues that directly contact c-Myb TAD in the solution structure. The average combined resolution for the 1H and 15N dimensions in the HSQC was 0.03 ppm. Chemical shift changes greater than this value are considered.

