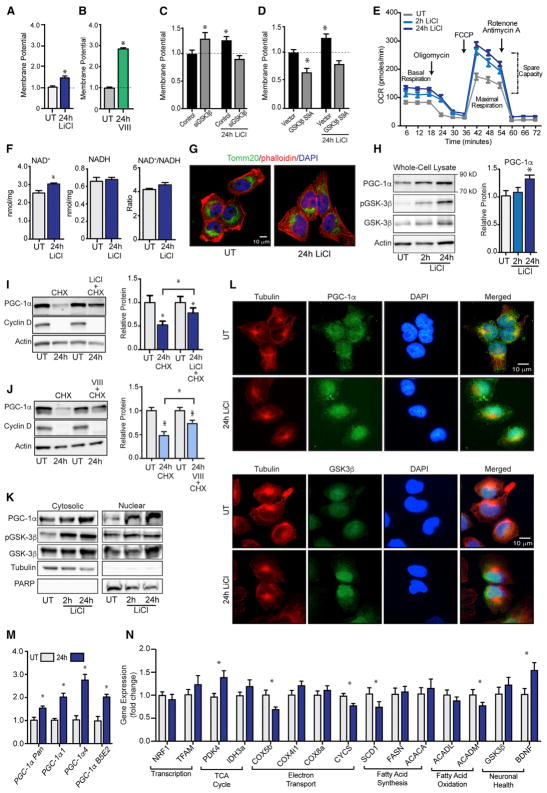
Figure 1. GSK3β Regulates Mitochondrial Metabolism and PGC-1α Stability, Localization, and Activity in H4 Glioma.
(A–D) JC-1 measurement of mitochondrial membrane potential following (A) LiCl (15 mM) or (B) inhibitor VIII (15 μM) treatment and following LiCl treatment (15 mM) in cells transfected with GSK3β siRNA (C) or GSK3β-S9A (D).
(E–J) Basal and maximal cellular respiration (E); NAD+, NADH, and NAD+/NADH ratio (F); immunodetection of mitochondrial Tomm20 (G); PGC-1α, GSK3β, GSK3β, and actin protein levels following 2- or 24-hr LiCl treatment (H); PGC-1α, cyclin D, and actin protein detection in cells treated with cyclohexamide (100 μM) in the absence or presence of LiCl (15 mM) (I); or inhibitor VIII (15 μM) (J).
(K–N) Protein levels of PGC-1α, pGSK3β, GSK3β, tubulin, and PARP protein in cytoplasmic and nuclear fractions following 24-hr LiCl treatment (K); immunodetection of tubulin, PGC-1α, and GSK3β (L); RT-PCR detection of PGC-1α (M); and the indicated transcripts following LiCl treatment (N).
n = 3–6 biological replicates per assay; data are shown as an average ± SEM; *p < 0.05 ANOVA.

