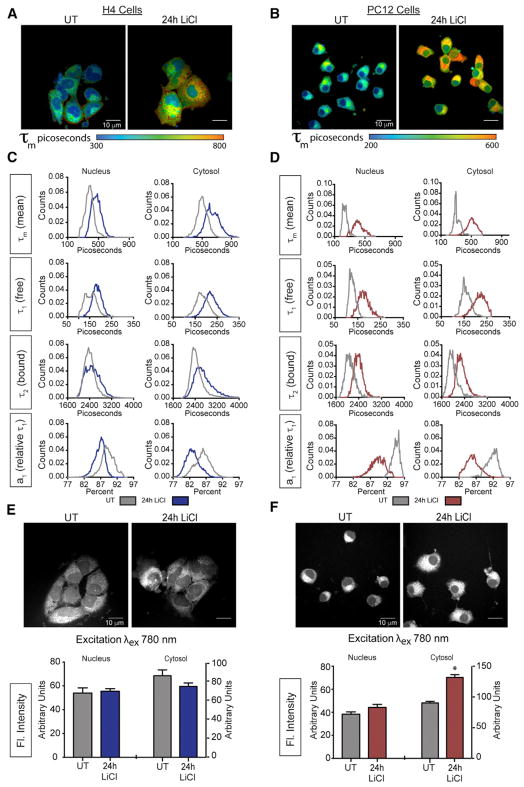
Figure 3. GSK3β Affects Cellular NAD(P)H Metabolism.
(A and B) Representative image showing mean fluorescence lifetime (τm) in picoseconds (exλ780) in the absence or presence of LiCl (15 mM) for H4 glioma (A) and PC12-derived neurons (B).
(C and D) Distributions of mean fluorescence lifetime τm (top rows), short component τ1 (upper middle rows), long component τ2 (lower middle rows), a1, the relative contribution of τ1 to τm (bottom row) before and after 24 hr LiCl treatment for H4 glioma (C) and PC12-derived neurons (D).
(E and F) NAD(P)H fluorescent intensity within the nucleus and cytoplasm following 24-hr LiCl treatment (15 mM) for H4 glioma (E) and PC12-derived neurons (F).
n = 6–8 biological replicates per measure; data are shown as a distribution or as an average ± SEM; *p < 0.05, linear mixed model.

