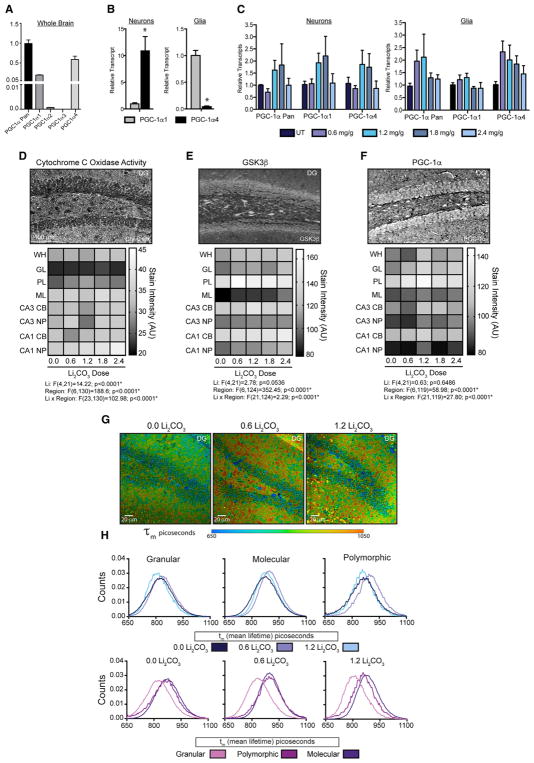
Figure 4. Inhibition of GSK3β Regulates Hippocampal Energy Metabolism in Mice.
(A and B) RT-PCR detection of PGC-1α isoforms in the whole-mouse brain (A) or in isolated neurons and glia (B).
(C) RT-PCR detection of PGC-1α isoforms in neurons and glia isolated from the whole brain of mice fed the indicated doses of dietary lithium carbonate (Li2CO3) for 4 months.
(D–F) Representative images and quantification of cytochrome C oxidase mitochondrial activity stain (D), GSK3β immunodetection (E), and PGC-1α immunodetection in the indicated hippocampal regions from Li2CO3 fed mice (F).
(G and H) Representative images of mean fluorescence lifetime (τm) in picoseconds (exλ780) in the dentate gyrus from Li2CO3 fed mice (G) and τm distributions separated by region (top panel) and by dose (bottom panel) (H).
n = 4–6 mice per Li2CO3 dosage; data shown as an average ± SEM or distributions; *p < 0.05, linear mixed models. WH, whole hippocampus; DG, dentate gyrus; GL, granular layer; PL, polymorphic layer; ML, molecular layer; CB, cell bodies; and NP, neuropil.

