Figure 3.
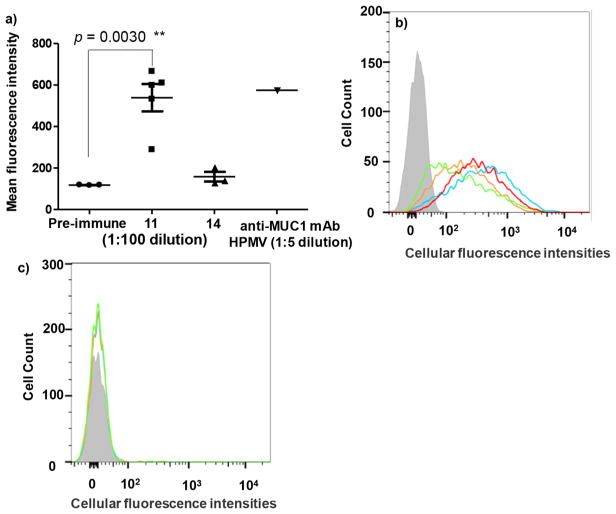
Flow cytometry analysis of the specific recognition of tumor cells by anti-MUC1 IgG antibodies. (a) Mean fluorescence intensities of binding of RMA-MUC1 cells by pre-immune sera and sera from mice immunized with vaccine constructs 11 and 14 respectively (1:100 dilution); MUC1 expression on RMA-MUC1 was confirmed by anti-MUC1 mAb HPMV (1:5 dilution). Immunization with 11 induced antibodies capable of binding RMA-MUC1 much stronger than those from 14 immunized mice. (b) Binding of RMA-MUC1 cells by sera from mice immunized with 10 (blue curve), 11 (orange curve), 12 (green curve), and 13 (red curve) at 1:50 dilution. The gray filled trace was from pre-immune serum. All post-immune sera showed strong binding to RMA-MUC1 cells. (c) Little binding to RMA cells lacking MUC1 was observed with anti-MUC1 sera at 1:50 dilution.

