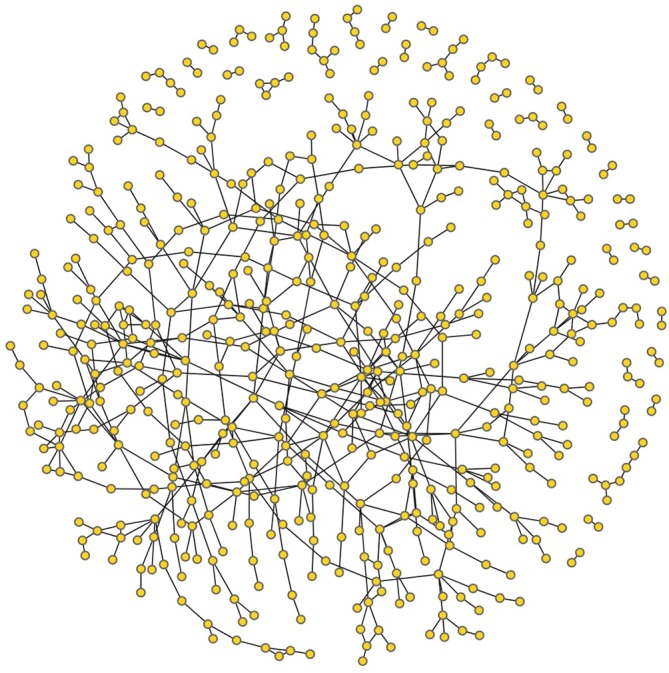
Figure 2.

Visualisation of the friendship network of the 824 young men of Vashantek. Here we show the social network graph for 824 respondents. Each node represents an individual respondent. The connector shows the friendship ties between two respondents. There are 267 respondents who are completely isolated (not included in the figure). The largest component consists of 450 respondents who are all connected with each other through intermediate ties. We also have 37 smaller components with smaller networks.
