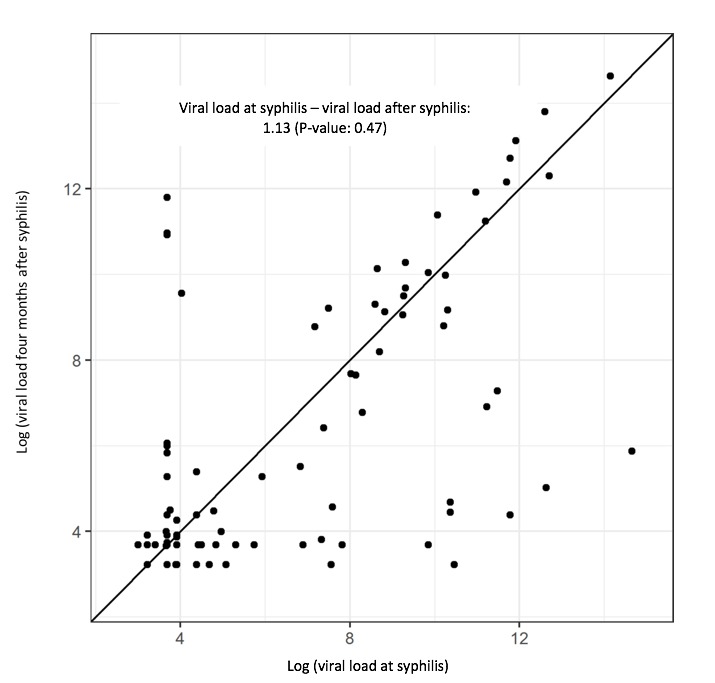
Figure 5.

Scatter plot of viral load (adjusted on a logarithmic scale to account for wide variation in values) at syphilis diagnosis versus viral load at follow-up appointment after treatment of syphilis. Viral load was noted to increase by an average of 3.09 copies/mL in relation to syphilis coinfection (p=0.47).
