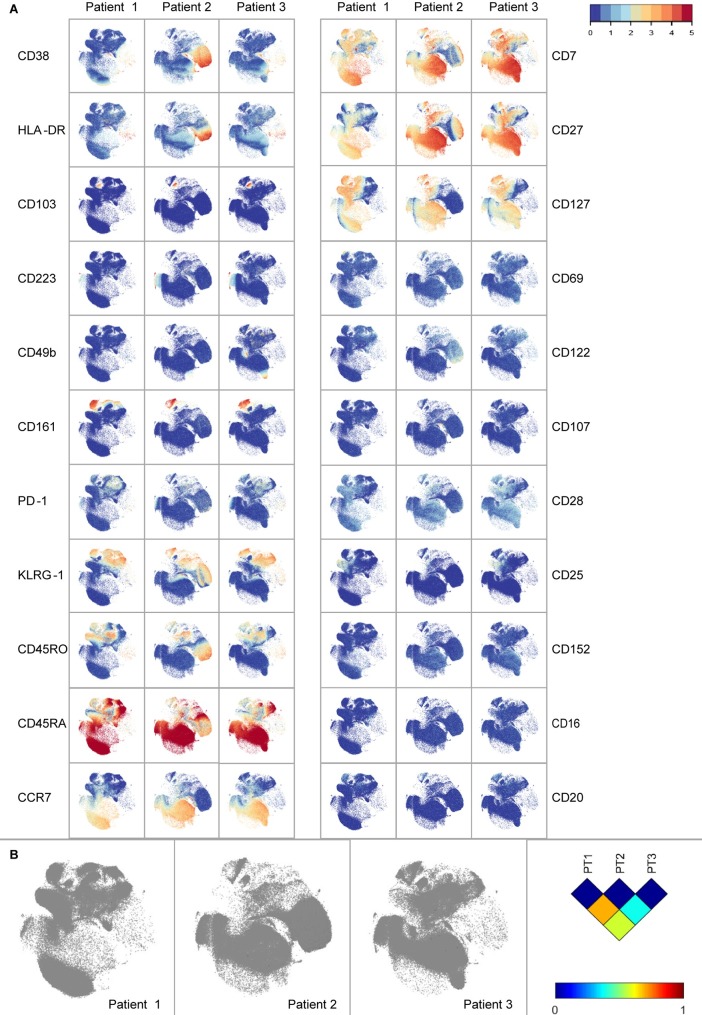
Fig 2. Marker expression visualization.
a) t-SNE of CD8 compartment of three T1D patients. Markers CD8, CD3 and TCRgd used for gating, as well as the negative markers NKp44 and NKp46 are not displayed. b) Jensen-Shannon divergence plots of t-SNE maps comparing three patients. Higher values indicate more dissimilarity between a pair of t-SNE maps.

