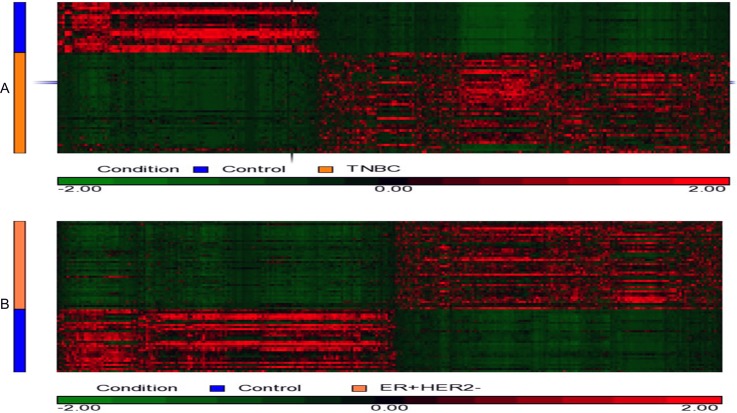
Fig 1. Hierarchical clustering heatmaps of BC based on the DESeq-normalized gene expression levels.
The genes with similar expression patterns are clustered together. The up-regulated genes are in red and the down-regulated genes are in green. (A) A heatmap based on gene expression levels of 1,693 DEGs uniquely identified in TNBC data. (B) A heatmap based on gene expression of 2,299 DEGs uniquely identified in ER+HER2-BC data.

