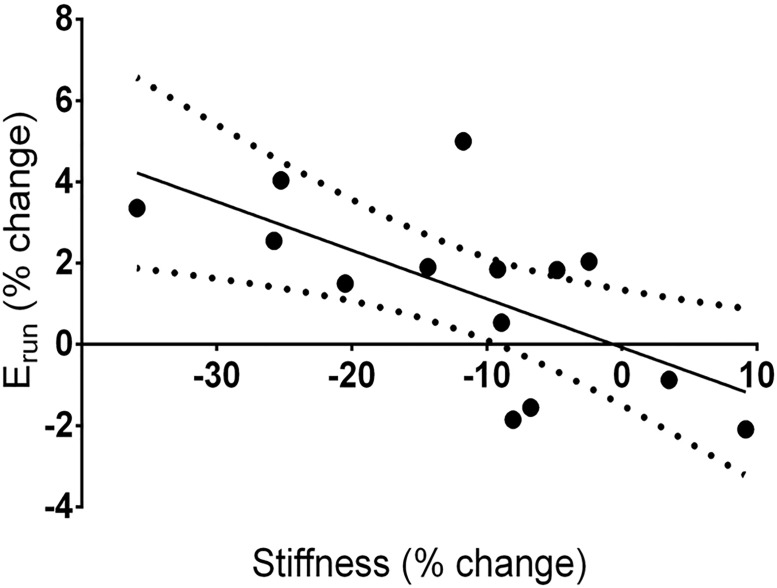
Fig 5. Relationship between the change in Erun and AT stiffness following 90 min run.
The solid line represents the linear relationship between Erun and stiffness (r2 = 0.430, p = 0.011). Dashed lines represent the 95% confidence interval for the relationship. Note that the relationship crosses the abscissa at 0% change in stiffness.

