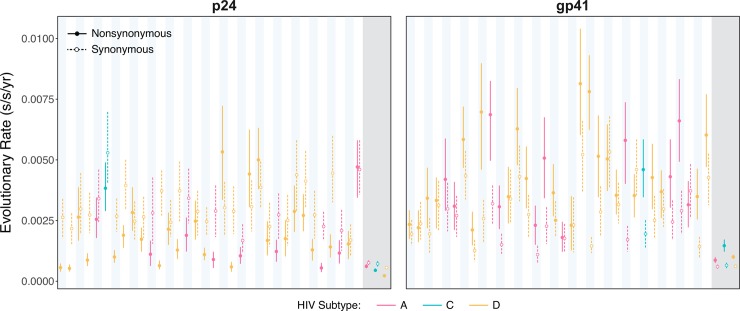
Fig 2. Evolutionary rates for p24 and gp41 at the within- and between-hosts scales measured in substitutions per site per year (subs/site/year).
The within-host nonsynonymous (filled circles) and synonymous (open circles) substitution rates were estimated for p24 and gp41 for all 34 individuals, which are ordered from left to right (subtype A, pink; subtype C, green; subtype D, yellow). Blue and white columns correspond to the individual estimates. The estimates in the grey background indicate the between-host substitution rates for subtypes A, C, and D. The vertical lines represent the 95% credible intervals (solid lines, nonsynonymous; dashed lines, synonymous).

