
Extended Data Figure 1. Loss of FTCD decreases the sensitivity of cancer cells to methotrexate.
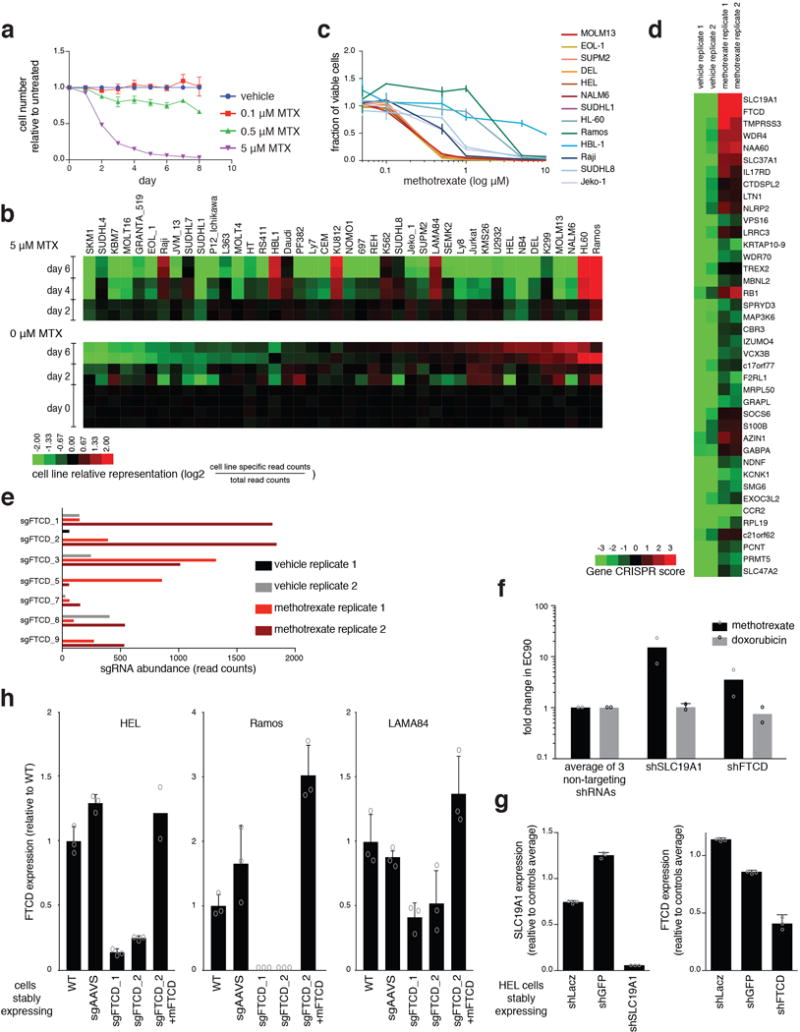
a. Relative daily cell counts of the mixed culture of 42 genomically-barcoded hematopoietic cancer cell lines. List of cell lines can be found in Source Data_1, sheet “barcoded cell lines”. We focused our efforts on hematopoietic cell lines because methotrexate is most commonly used to treat hematopoietic malignancies9. Cells were co-cultured and treated with three concentrations of methotrexate (0.1, 0.5, or 5 μM). Cell counts are presented relative to the vehicle-treated co-culture. n=3, biological replicates. Error bars indicate SD. b. Sequencing results of the competitive co-culture experiment. Heatmap of relative barcode abundance for each indicated cell line following treatment with 5 μM methotrexate or vehicle after 2, 4, or 6 days compared to those in the initial cultures. Raw data of sequencing results can be found in Source Data_1 sheet “Counts_sequencing”. c. Validation of the results of the competitive co-culture experiment as shown by individual dose-response curves of seven relatively sensitive cell lines (MOLM13, EOL-1, SUPM2, DEL, HEL, NALM6, SUDHL1), and six relatively resistant cell lines (HL-60, Ramos, HBL-1, Raji, SUDHL8, Jeko-1). n=2, biological replicates. Each biological replicate included technical triplicate. Error bars indicate SD. d. Top 40 genes that scored in the genome-wide CRISPR/Cas9-based positive selection screen. These genes had the largest differential CRISPR scores between vehicle- and methotrexate-treated samples. The heatmap represents the CRISPR score of two biological replicates of each screen (vehicle- and methotrexate-treated). CRISPR score of all genes can be found in Source Data_1, sheet “CRISPR score”. e. Abundance of each of the individual sgRNAs targeting FTCD in the screen. Read counts for each sgRNA is presented for each of the screen biological replicates of the vehicle-treated and methotrexate-treated samples. See also Source Data_1, sheet “screen rpm” for read counts raw data, including the genes HAL and AMDHD1. f. Fold-change in methotrexate EC90 and doxorubicin EC90 in HEL cells stably expressing shRNA targeting either SLC19A1 or FTCD compared to the average of three non-targeting shRNAs (shGFP, shRFP, and shLacZ). n=2, biological replicates. Each biological replicate included technical triplicate. g. Expression levels of SLC19A1 (left) and FTCD (right) in HEL cells stably expressing non-targeting shRNAs (shLacZ and shGFP) or targeting shRNAs (shSLC19A1 and shFTCD). Expression levels were measured by qPCR and normalized to the average of two control genes, UBC and HPRT. n=3, technical replicates. h. Validation of genetic depletion of FTCD by the CRISPR/Cas9 system in HEL, Ramos and LAMA84 cell lines. Expression of FTCD was measured by qPCR and normalized to the average of two control genes, UBC and HPRT. n=3 (except for HEL cells expressing sgFTCD_2 + mFTCD, then n=2 due to loss of RNA from one sample), biological replicate. Error bars indicate SD. Raw data of survival curves of these lines can be found in Source Data_1, sheet “Survival MTX”.