
Extended Data Figure 4. The histidine degradation pathway affects the sensitivity of cancer cells to methotrexate and HAL expression is associated with treatment response in acute lymphoblastic leukemia (ALL) patients (part 1).
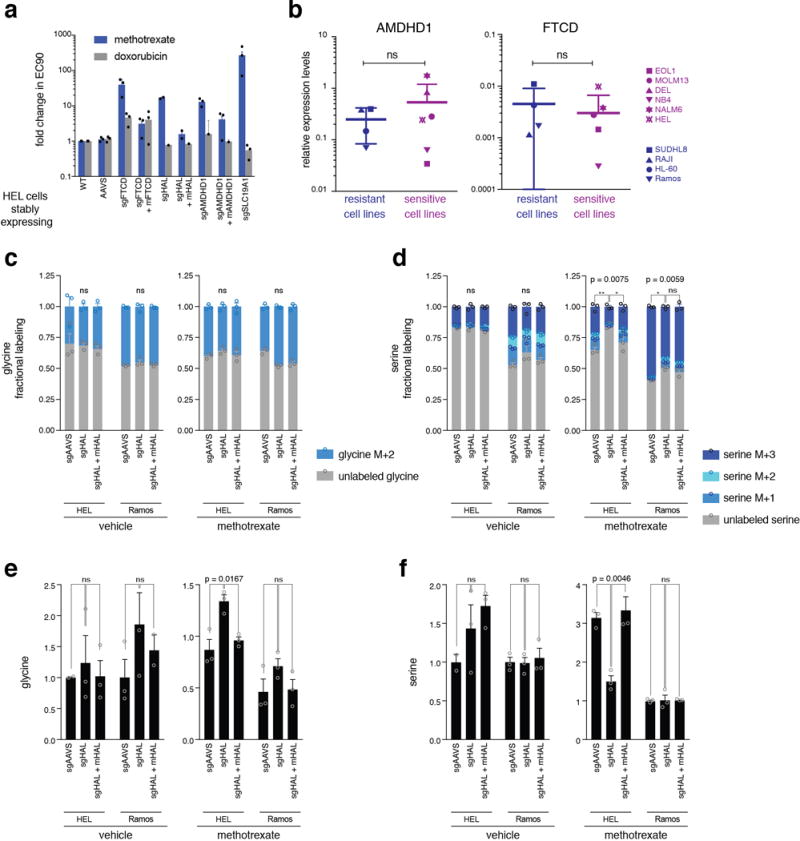
a. Genetic depletion of the enzymes HAL and AMDHD1 decreased sensitivity to methotrexate, but not to a control drug, doxorubicin. Cell viability after treatment with varying concentrations of methotrexate and doxorubicin was used to calculate the EC90s. n=3, biological replicates. Raw data of survival curves can be found in Source Data_3, sheet “Survival MTX”. b. Expression levels of AMDHD1 (left) and FTCD (right) were not significantly different across methotrexate-sensitive hematopoietic cell lines compared to methotrexate-resistant cell lines. The response to methotrexate was determined in a pooled fashion using genomically-barcoded cell lines (Fig. 1a and Extended Data Fig. 1a-c). Expression levels of AMDHD1 and FTCD were measured by qPCR and normalized to the average of control genes (UBC and HPRT). p-values were calculated using the KS test. n=4 for resistant cell lines and n=6 for sensitive cell lines (biologically independent samples). Each qPCR included three technical replicates. c. Fractional labeling of glycine by [U-13C] serine is unchanged by HAL depletion in HEL and Ramos cells in vehicle-and methotrexate-treated cells. d. Uptake of [U-13C] serine is higher in methotrexate-treated control cells but not in methotrexate-treated HAL-deficient cells. e. Glycine levels are not significantly different between HAL-deficient and control cells except for HEL cells treated with methotrexate. f. Serine levels are not significantly different between HAL-deficient and control cells except for HEL cells treated with methotrexate, where HAL-deficient HEL cells have similar levels of serine as vehicle-treated cells. For c-f: Glycine and serine levels were normalized to isotopically-labeled glutamate as an internal standard. p-values were calculated for the unlabeled fraction (c, d) or to total values (e, f) by one-way ANOVA. n=3, biological replicates. Source data for Fig. 3b-d and Extended Data Fig. 4c-f can be found in the file Source Data_3, sheet “metabolite profiling”.