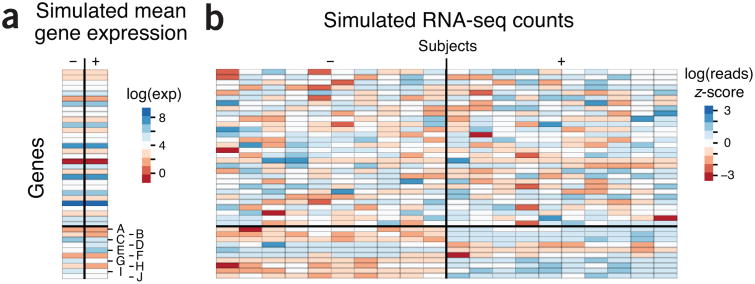
Figure 1.
Simulated expression and RNA-seq read counts for 40 genes in which the last 10 genes (A–J) are differentially expressed across two phenotypes (−/+). Simulated quantities and heat maps are log-scaled. (a) Simulated log mean expression levels for the genes generated by sampling from the normal distribution with mean 4 and s.d. 2. In the + phenotype the differential expression of genes A–J was created by the addition of a standard normal to each mean expression in the – phenotype. (b) The simulated RNA-seq read counts for ten subjects in each phenotype generated from an overdispersed Poisson distribution based on mean expression in a with biological variation. The heat map shows z-scores of the read counts normalized across all 20 subjects for a given gene.

