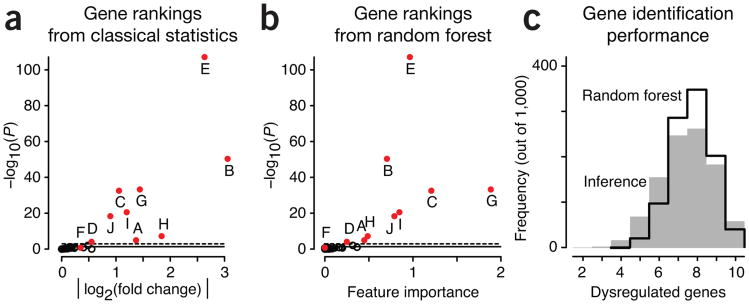
Figure 2.
Analysis of gene ranking by classical inference and ML. (a) Unadjusted log-scaled P values from statistical differential expression analysis as a function of effect size, measured by fold change in expression. (b) Log-scaled P values from a as a function of gene importance from random forest classification. In a and b, red circles identify the ten differentially expressed genes from Figure 1; the remaining genes are indicated by open circles. (c) Distribution of the number of dysregulated genes correctly identified in 1,000 simulations by inference (gray fill) and random forest (black line).

