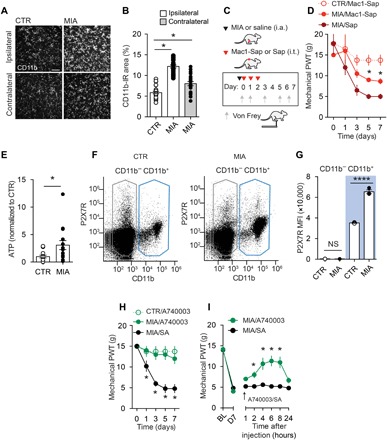
Fig. 1. Spinal microglia critically contribute to MIA-induced joint pain.

(A) Representative images (scale bar, 100 μm) and (B) quantification of CD11b immunofluorescence in the L3-L5 spinal dorsal horn from MIA (2 mg) and saline CTR rats 7 days after injection (CTR/Ipsi, n = 27; MIA/Ipsi, n = 21; MIA/Contra, n = 21). (C) Schematic depicting drug administration paradigm in rats injected with intra-articular (i.a.) MIA (2 mg) or saline (CTR) and intrathecal (i.t.) Mac1-saporin (Sap; 15 μg) or saporin (15 μg). (D) Mechanical paw withdrawal threshold (PWT) (CTR/Mac1-Sap, n = 4; MIA/Mac1-Sap, n = 6; MIA/Sap, n = 4). (E) ATP levels in rat CSF and (F and G) flow cytometric analysis of P2X7R expression in spinal cord cell populations 7 days after injection of MIA (n = 9) or saline (CTR, n = 9). (F) Representative dot plot from CTR and MIA rats depicting gating parameters for CD11b− (black) and Cd11b+ (blue) populations. (G) Histogram of P2X7R mean fluorescence intensity of CD11b− and CD11b+ populations (MIA, n = 3; CTR, n = 3). NS, not significant. Effect of intrathecal A740003 on mechanical threshold following (H) continuous delivery [CTR/A740003, n = 4; MIA/A740003 10 μM, n = 5; MIA/saline (SA), n = 5] and (I) single injection intrathecally on day 7 (arrow) (MIA/A740003 30 μM, n = 5; MIA/SA, n = 6). *P < 0.05; ****P < 0.0001, one-way analysis of variance (ANOVA) (B and G), two-way repeated-measures ANOVA (D, H, and I) followed by Sidak post hoc test, and unpaired t test (E).
