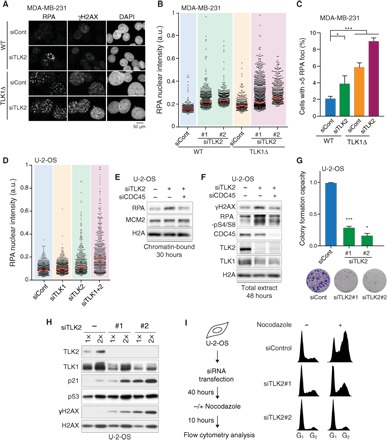
Fig. 3. Loss of TLK activity leads to DNA unwinding, accumulation of DNA damage, and loss of viability.

(A) Immunofluorescence analysis of MDA-MB-231 cells costained with antibodies against RPA, γH2AX, and DAPI. (B) High-throughput microscopy (HTM) analysis of chromatin-bound RPA in parental MDA-MB-231 (WT) or TLK1-null cells (TLK1Δ) 72 hours after siRNA transfection. One representative experiment of n = 3 biological replicates is shown; median is indicated in red. After normalization to siCont (WT) average, one-sample t test was used for statistical analysis of n = 3 independent experiments: significance of P = 0.1475 was observed for siTLK2#1 (WT), **P = 0.0015 for siTLK2#2 (WT), P = 0.0917 for siTLK2#1 (TLK1Δ), and **P = 0.0014 for siTLK2#2 (TLK1Δ) relative to siCont (WT). Differences between siCont (TLK1Δ) and siCont (WT) were not significant. (C) Quantification of the MDA-MB-231 cells with more than five RPA foci. At least 300 nuclei were analyzed, and the mean with SEM is shown for independent cultures (n = 10 for siCont; n = 6 for siTLK2). An unpaired two-tailed t test was used for statistical analysis. *P < 0.05, ***P < 0.001. (D) HTM analysis of the chromatin-bound RPA in U-2-OS cells 48 hours after siRNA transfection. One representative experiment of n = 6 biological replicates is shown; median is indicated in red. After normalization to siCont average, one-sample t test was used for statistical analysis of at least n = 6 independent experiments: significance of P = 0.0514 was observed for siTLK1, P = 0.0005 for siTLK2, and P = 0.0120 for siTLK1+2. (E and F) Analysis of replication stress response in U-2-OS cells transfected with TLK2 siRNAs alone or together with CDC45 siRNAs for 30 hours (E) or 48 hours (F). One representative experiment of two biological replicates is shown for (E) and (F). (G) Colony formation assay in U-2-OS cells transfected with TLK siRNAs. Data represent means and SEM of biological replicates (n = 5 for siCont, n = 4 for siTLK2#1, and n = 2 for siTLK2#2), each done at least in technical duplicates. A one-sample t test was used for statistical analysis. ***P = 0.0001 for siTLK2#1 and *P = 0.0324 for siTLK2#2. (H) Western blot analysis of U-2-OS cell lysates after 48 hours of siRNA transfection, representative of three independent experiments. (I) Cell cycle progression analyzed by flow cytometry of cells treated with nocodazole and stained with PI. The experimental design (left) and representative cell cycle profiles (right) from one of n = 3 biological replicates are shown.
