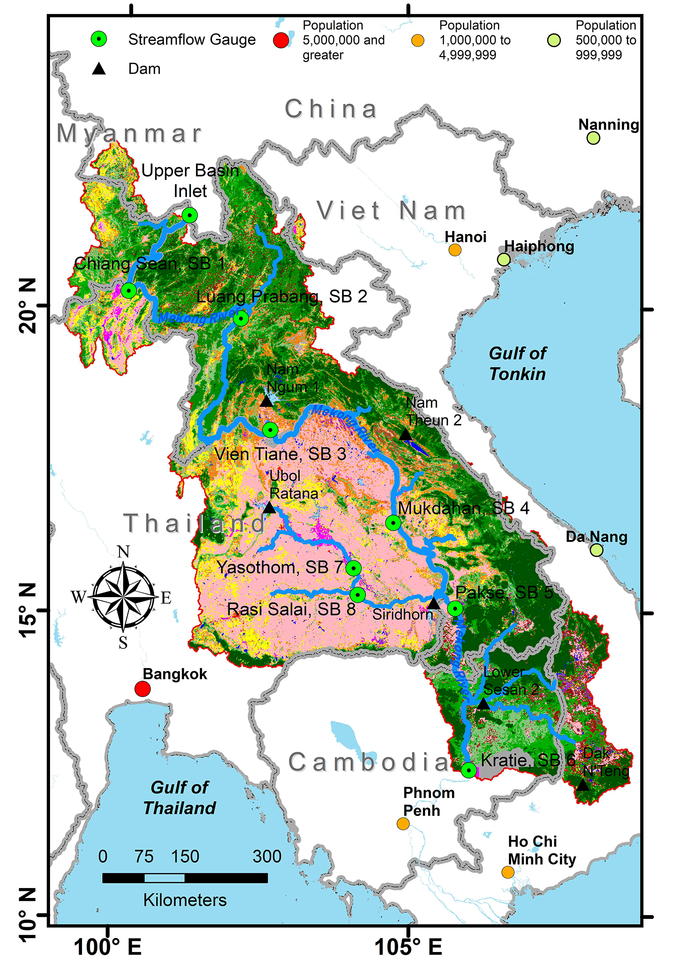
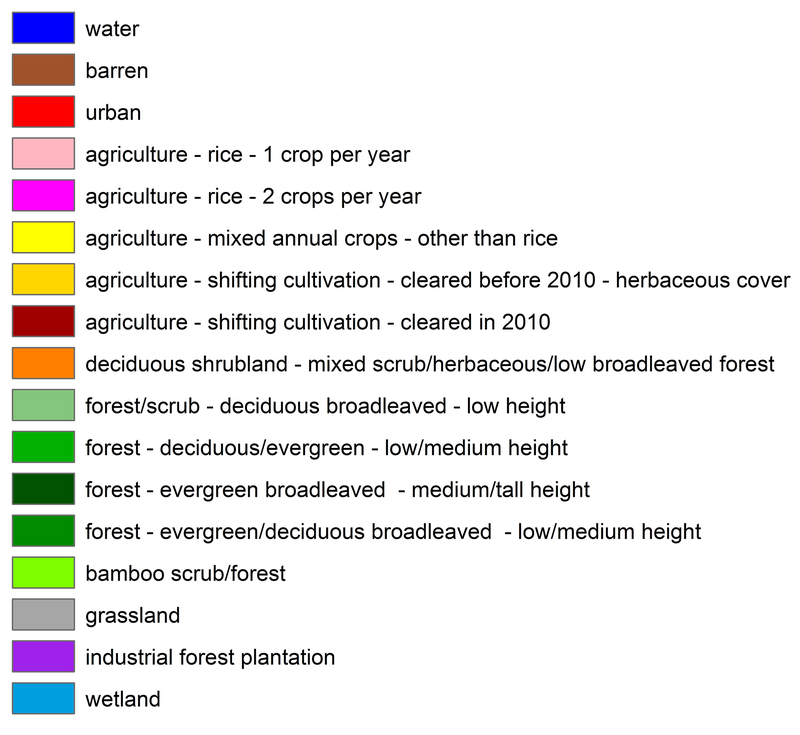
Figure 1.
The Lower Mekong River Basin. Streamflow gauges follow the Lower Mekong River Basin subareas presented by Rossi et al., (2009). Cities with population classes obtained from Environmental Systems Research Institute, Inc. (ESRI) World Populated Places layer (https://www.arcgis.com/home/index.html, accessed on 31 May 2018) are depicted in red (greater than 5 million), orange (1–5 million), and light green (0.5–1 million). Land use and land cover class descriptions are given as a separate legend. Dam data are described in Appendix A.1.


