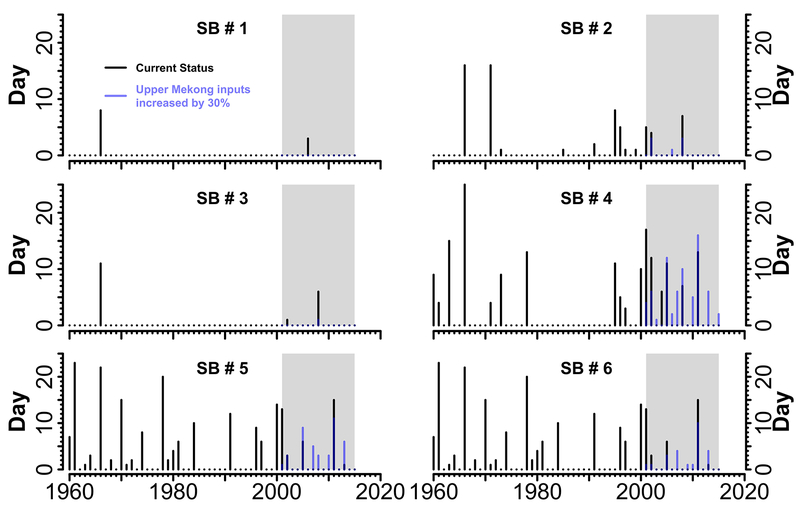
Figure 10.
Flood duration (FLDDUR) analyses at the LMRB. The flood duration in days are the number of days when discharge equals or exceeds a threshold discharge magnitude causing floods. Black bars give flood duration in days for the 1960–2015 time period calculated from observed discharges, and blue bars give flood duration calculated from simulated discharges with the UMRB inflow increased by 30%. Simulation discharge time period is 2001–2015 highlighted in gray. Sub-basin watersheds follow description in Figure 1.

