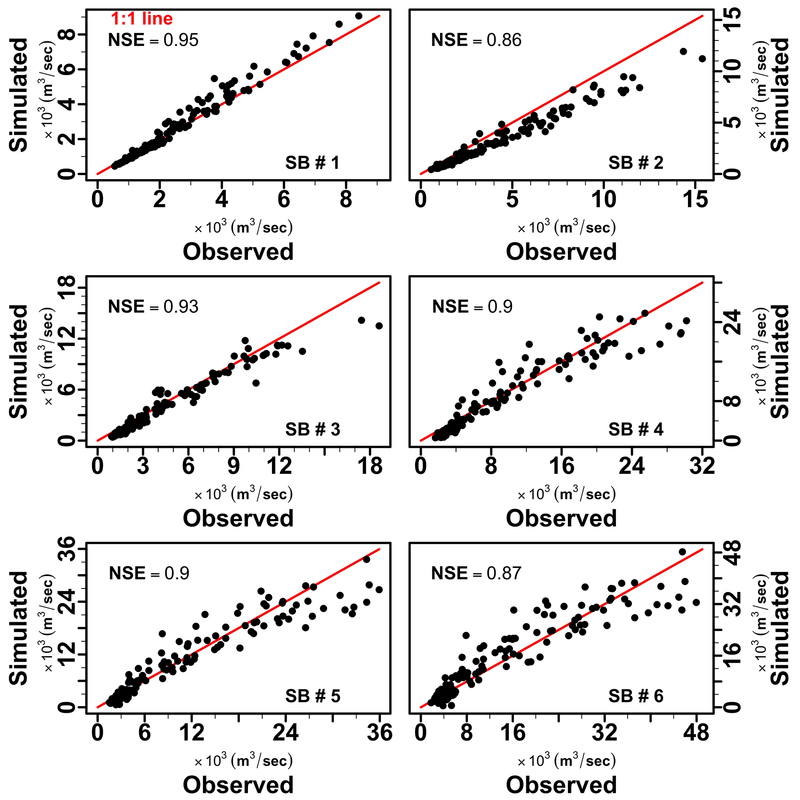
Figure 5.
Scatterplot of monthly observed and simulated discharge in m3/sec for the Lower Mekong River at six sub-basin watersheds in validation of the LMRB model during 2001–2004, and 2007–2015. The Nash–Sutcliffe (NSE) performance metrics during validation time period are depicted for each sub-basin.

