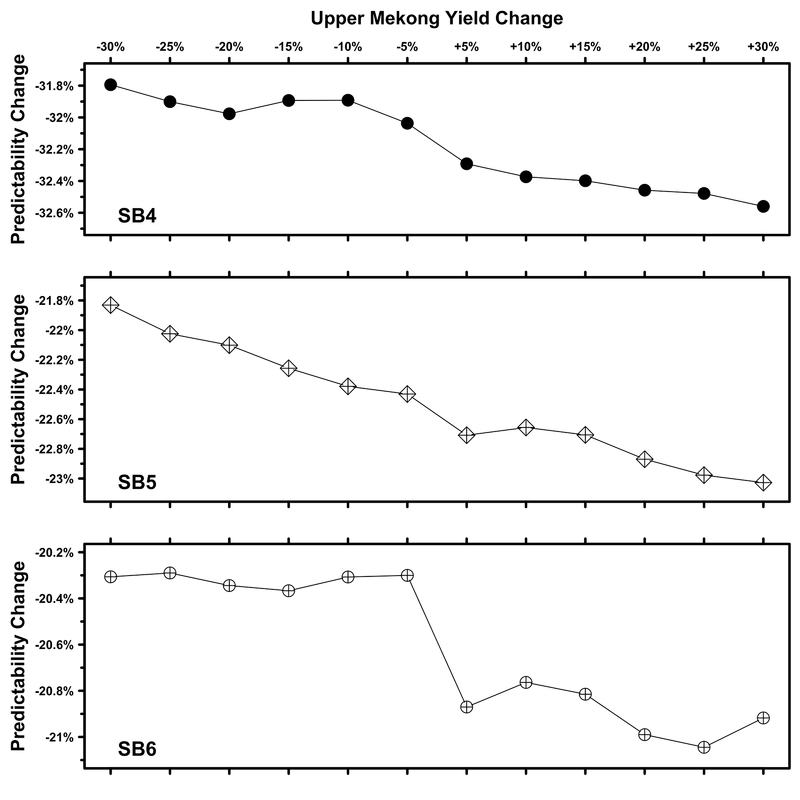
Figure 7.
Sensitivity analysis for the Lower Mekong River Basin Colwell index predictability (P). Observed predictability during 2001–2015 time period at SB4, SB5, and SB6 is 0.342, 0.325, 0.317 respectively. Predictability change from observed predictability depicted in y-axis at each panel were calculated from simulated flow obtained by driving the LMRB model with adjusted Upper Mekong River flow inputs during the 2001–2015 time period as outlined in x-axis. Predictability change (y-axis) reports the scaled predictability change, i.e., . Sub-basin watersheds follow description in Figure 1.

