
FIGURE 1.
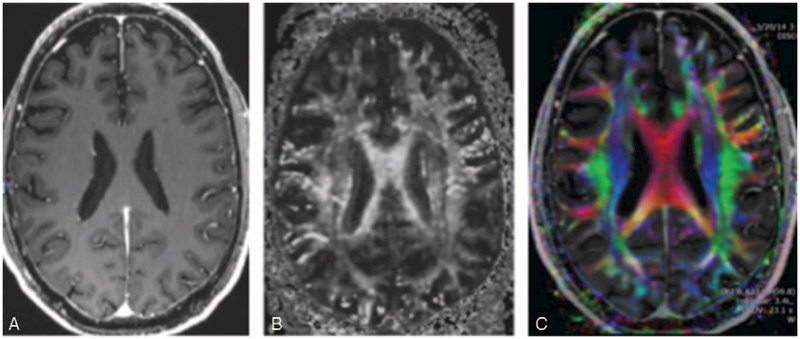
(A) T1-weighted inversion recovery prepared fast spoiled gradient-recalled (IR-FSPGR) postcontrast image. There is no ability to distinguish the different fiber tracts. For example, all of the white matter tracts within the centrum semiovale and the same intensity and directional information cannot be obtained. (B) DTI fractional anisotropy gray scale image. There is varying signal intensities within the white matter tracts within the centrum semiovale and fiber tracts are visualized separately. (C) DTI color-coded fractional anisotropy. The colors correspond to the direction of the fiber tracts with red, blue, and green tracts denoting transverse, superior-inferior, and anterior-posterior directions, respectively. Different components of white matter fascicles can be much more clearly delineated.