
FIGURE 6.
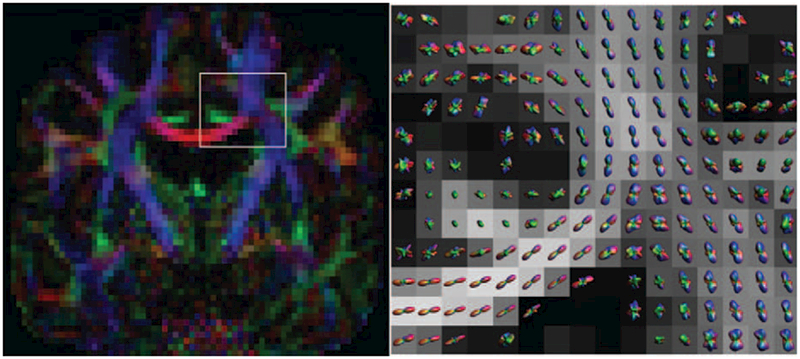
Example output from a Q-ball Imaging scan. On the left, a conventional diffusion-encoded color map. On the right, a zoomed region—as indicated—with the probability distributions in each voxel shown over an FA map. Clear single-fiber areas (corpus callosum) and crossing fiber areas (more laterally) can be observed in these voxel-wise distributions, with QBI being able to resolve these fiber crossings. QBI acquisition: 112 × 112 matrix with 22.4 × 22.4cm field-of-view, 70 axial slices of 2 mm thickness. 6 b = 0 images, 60 gradient directions at b = 2500s/mm2. SENSE acceleration factor 2, TE/TR = 107ms/10.3 s, acquisition time 11m20s.