
FIGURE 7.
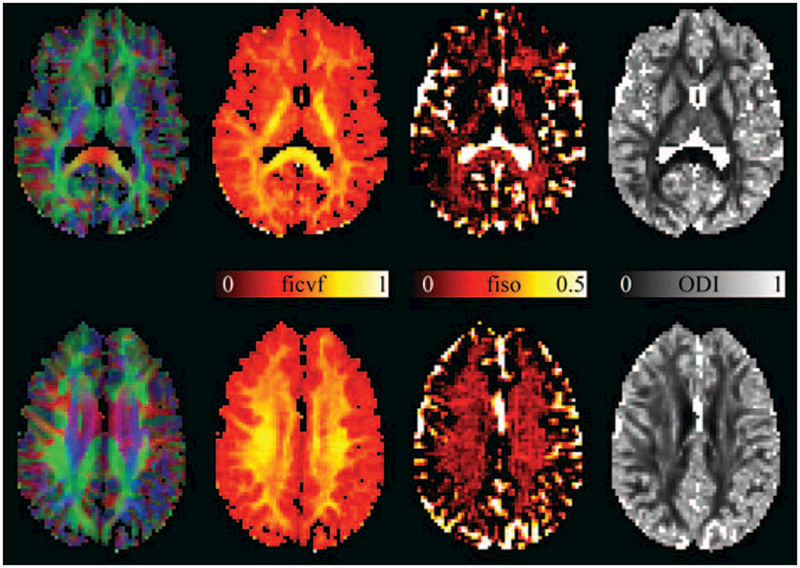
Example images from model parameters from NODDI, the intracellular volume fraction (ficvf), isotropic volume fraction (fiso), and orientation dispersion index (ODI). The color-encoded DEC map is shown on the left to indicate location within the brain. Values of ficvf are high in neurite-rich areas such as white matter, as can most clearly be seen in the internal capsule and the splenium of the corpus callosum. The fiso maps accurately highlight the ventricles and surrounding CSF that have a very high isotropic diffusivisity. The orientation dispersion index (ODI) maps the dispersion of neurites around the principal diffusion direction. In single-fiber regions in the white matter, this can be regarded as an indication of the coherence of the axons in that voxel. This can most clearly be seen in the posterior limb of the internal capsule, wherein the ODI is low indicating high axonal coherence. NODDI scan parameters: 96 × 96 matrix, 240 × 240 mm FOV, 50 slices of 2.5 mm thickness, 11 b = 0 images, and 8, 32, and 64 DWIs at b-values of 300, 700, and 2500 s/mm2, respectively. SENSE acceleration factor 2, TE/TR 71.7/5200 ms, acquisition time 9m58 s.