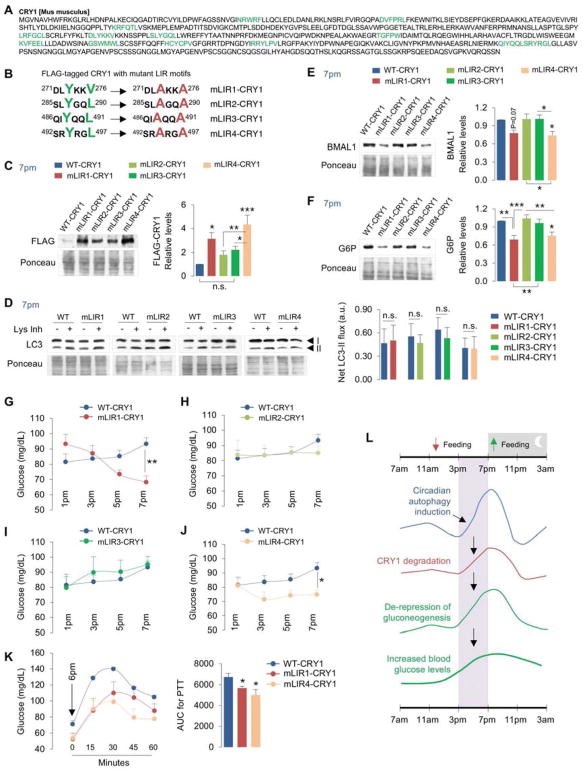
Fig. 5. LIR motifs determine CRY1 degradation and regulation of gluconeogenesis.
(A) Murine CRY1 has 13 LIR motifs (green).
(B) Inactivation of selected LIR motifs (mLIR1-4) on CRY1 via mutagenesis of tyrosine (Y), valine (V) or leucine (L) residues (green) to alanine (A) (red).
(C) IB for FLAG in livers from male mice at 7pm expressing FLAG-tagged wildtype (WT)-CRY1 plasmid or each FLAG-tagged CRY1 LIR mutant plasmid (mLIR1-4), n=12.
(D) IB for LC3 in livers from male mice at 7pm expressing FLAG-tagged WT-CRY1 or each CRY1 LIR mutant (mLIR1-4) and cultured in presence or absence of Lys Inh for 2 hr, n=7–10.
(E, F) IB for BMAL1 and G6P in livers from male mice at 7pm expressing FLAG-tagged WT-CRY1 plasmid or each CRY1 LIR mutant plasmid (mLIR1-4), n=8–12.
(G–K) Blood glucose levels at indicated timepoints, n=9–16, and i.p. PTT at 6pm from male mice expressing FLAG-tagged WT-CRY1 plasmid or each CRY1 LIR mutant plasmid in liver, n=5.
(L) Cartoon summarizing temporal autophagic degradation of CRY1 and its effects on gluconeogenesis and blood glucose levels.
Values are mean ± s.e.m. *P<0.05, **P<0.01, ***P<0.001. Student’s T-test, One-way or Two-way ANOVA and Bonferroni correction. Ponceau is the loading control. See also Figure S5.

