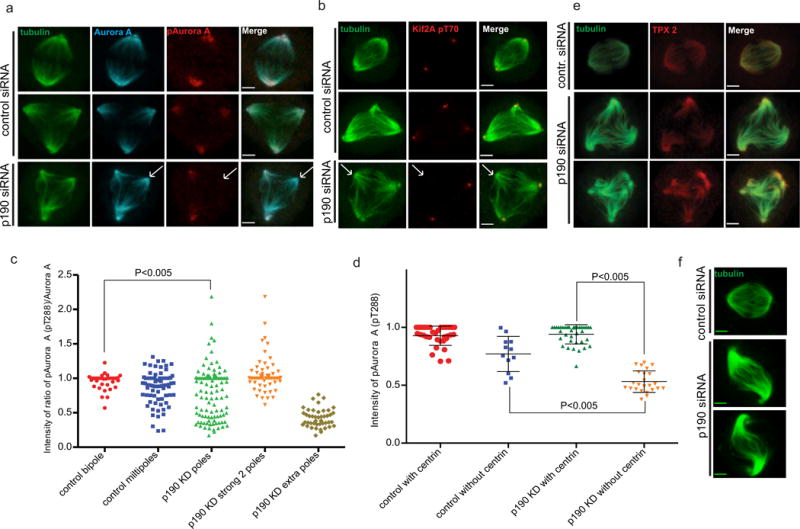
Fig. 6. p190 is required to activate Aurora A kinase on acentriolar poles.

a. Aurora A is properly localized to all poles but it is not active at all poles. Confocal images of control- and p190-depleted cells fixed and co-stained with α-tubulin, Aurora A and T-loop phosphorylation for Aurora A (pT288) antibodies. First two panels represent examples of bipolar and multipolar HeLa cells treated with control siRNA; the third panel represents a p190-depleted multipolar cell. Arrows indicate an extra spindle pole in a p190-depleted cell. Images shown are representative of n>20. Scale bars represent 3 μm. b. Aurora A activity as measured with a phosphoantibody against an Aurora site on Kif2a is missing from poles that lack centrosomes. Arrows indicate extra spindle poles in p190-depleted cells. Images shown are representative of n>20. Scale bars represent 3 μm. c. Quantification of Aurora A activation in spindle poles measured as a ratio of T-loop divided by total Aurora A. Each dot in the plot represents a paired measurement of T-loop and Aurora A at a single centrosome. Ratio’s are not statistically different between control bipoles and multipoles but they are both different from p190-depleted poles P<0.005 (T test). To demonstrate that the bimodal distribution of Aurora activation is generated by differences between poles in the same cell we replotted the data in the third lane. The degree of Aurora A activation in the highest two poles is different than the levels in the additional pole in the same cell. d. p190 activates Aurora A at acentriolar poles. Control- and p190-depleted cells were fixed and co-stained with α-tubulin, centrin 2 and phospho-Aurora A pT288 antibodies. Intensity of phospho –T288 Aurora A was measured in each pole with or without a centriole in both control- and p190-depleted cells and plotted as a dot plot P<0.005 (ANOVA). e. Tpx2 levels at poles are not affected by p190 knockdown. Images shown are representative of n>20. Scale bars represent 3 μm. f. Confocal images of tubulin stained control and p190-depleted cells with wavy” bipolar spindles. P<0.005
