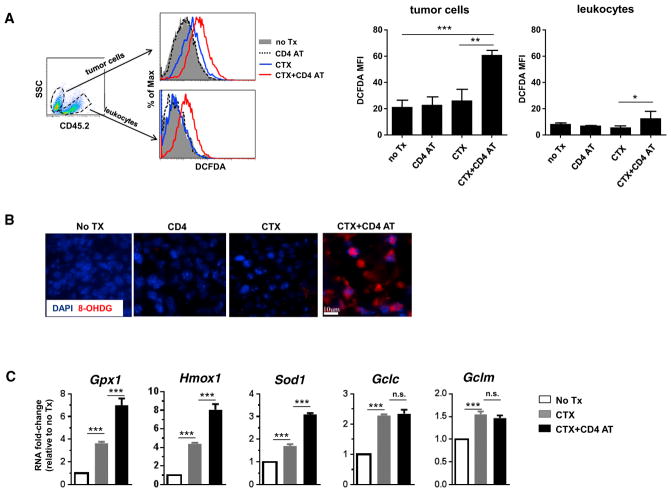
Figure 3. CTX + CD4 AT Leads to Heightened Oxidative Stress in Tumor Cells.
(A) Detection of ROS in tumor cells. Tumor-bearing mice were untreated (No Tx) or subjected to the indicated treatment. Seven days after T cell transfer, tumors were resected and processed into single-cell suspensions. Cells were stained with CD45.2 to distinguish CD45.2− tumor cells and CD45.2+ non-tumor cells (mostly leukocytes). Intracellular ROS levels were evaluated by CM-H2DCFDA staining. Representative flow cytometry data are shown as overlay of ROS histograms under different treatment conditions. The mean fluorescence intensities (MFI) of CM-H2DCFDA in tumor cells and leukocytes are summarized in bar graph on right.
(B) Resected tumors were subjected to 8-OHDG IF staining.
(C) Single-cell suspensions from resected tumors were flow sorted for CD45.2− tumor cells. Sorted tumor cells were subjected to quantitative real-time PCR in triplicate to evaluate the mRNA levels of the indicated genes. The target gene transcripts are normalized to β-actin, and fold changes relative to the no-treatment sample are shown in bar graphs.
* p < 0.05, **p < 0.01, ***p < 0.001; n.s., not significant. Error bars indicate SEM.

