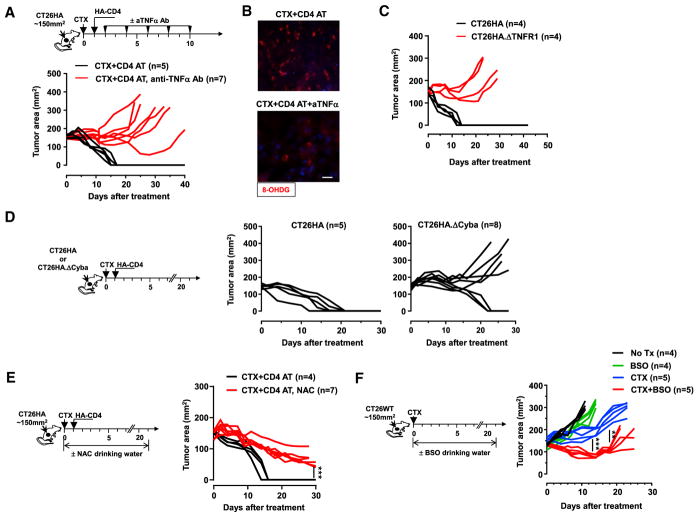
Figure 7. Induction of Oxidative Stress in Tumor Contributes to the Efficacy of CTX + CD4 AT in Mice.
(A and B) (A) The schema outlines the timeline of experimental procedures. Tumor-bearing mice were all treated with CTX followed by CD4 AT. Some of these mice received TNF-α-neutralizing mAb injection via intraperitoneal (i.p.) injection, 200 μg per injection. Tumor growth curves of each mouse are shown. Some mice were sacrificed 7 days after T cell transfer. Resected tumors were subjected to 8-OHDG IF staining (B); scale bar, 10 μm.
(C) Loss of TNF-α responsiveness renders tumor cells resistant to CTX + CD4 AT treatment. Mice with established CT26HA or CT26HA.ΔTNFR1 tumors were treated with CTX followed by CD4 AT. Tumor growth curves of each mouse are shown.
(D) CTX + CD4 AT treatment is less effective in treating p22phox-deficient tumors. Mice with established CT26HA or CT26HA.ΔCyba tumors were treated with CTX + CD4 AT. Tumor growth over time was monitored.
(E) Administration of antioxidant NAC impairs the curative effect of CTX + CD4 AT. The schema depicts the experimental design. Tumor-bearing mice were all untreated with CTX + CD4 AT. Some of these mice were fed with drinking water containing 10 mg/mL NAC. Tumor growth curves of each mouse are shown.
(F) Inhibition of GSH synthesis by BSO following CTX mediates improved antitumor effect. The schema depicts the experimental design. Tumor-bearing mice were subjected to the indicated treatment conditions. BSO (20 mM) was provided in drinking water. Tumor growth curves of each mouse are shown. **p < 0.01, ***p < 0.001.

