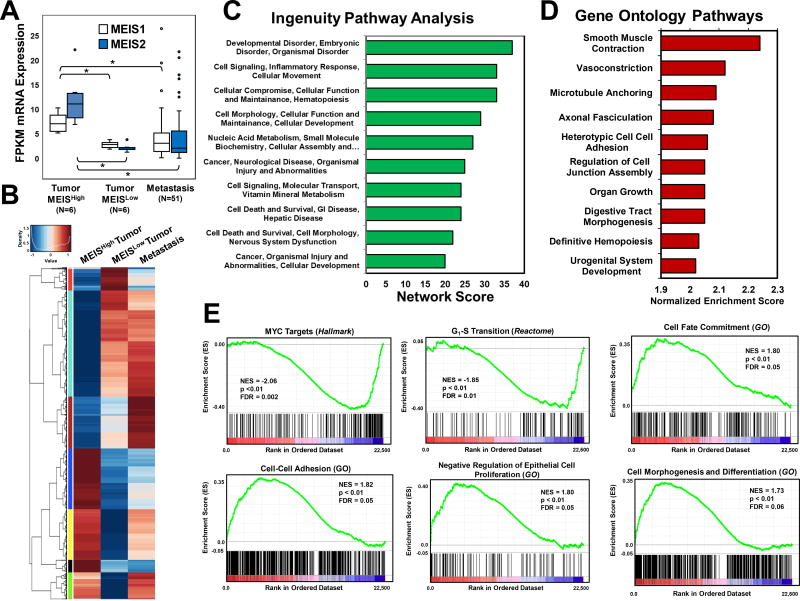
Figure 3. Identification Gene Sets and Networks Associated with MEIS and Prostate Cancer Progression.
(A) Box and whisker plots of MEIS1 and MEIS2 mRNA expression in MEISHigh tumors (n=6), MEISLow tumors (n=6), and metastasis (n=51) form RNA-Seq datasets. FPKM values for all genes were used to identify genes that were similar between MEISLow tumors and metastasis, and significantly different (1.5-fold, FDR<0.05) in the MEISHigh tumors.
(B) Heat map of differentially expressed genes between MEISHigh (left), MEISLow (center), and metastatic prostate cancer (right). Scores range from low expression (blue) to high expression (red). Gene lists and FPKM values are listed in Supplemental Table 3.
(C) Ingenuity Pathway Analysis (IPA) of the top ten networks derived from differentially expressed gene set between MEISHigh, MEISLow, and metastatic prostate cancer datasets.
(D) Top ten Gene Ontology (GO) Biological Processes derived arranged by normalized enrichment score of differentially expressed gene set between MEISHigh, MEISLow, and metastatic prostate cancer datasets.
(E) Gene Set Enrichment Analysis (GSEA) of significantly altered pathways between MEISHigh and MEISLow tumors. Normalize enrichment scores (NES) demonstrate that MEISHigh tumors have decreased expression of cMYC targets and genes regulating G1-S transition, and increased expression of genes involved in in cell fate commitment, cell-cell adhesion, negative regulators of cell proliferation, and cell morphogenesis and differentiation. Gene sets were obtained and analyzed against the Hallmark, Gene Ontology (GO), and Reactome datasets.

