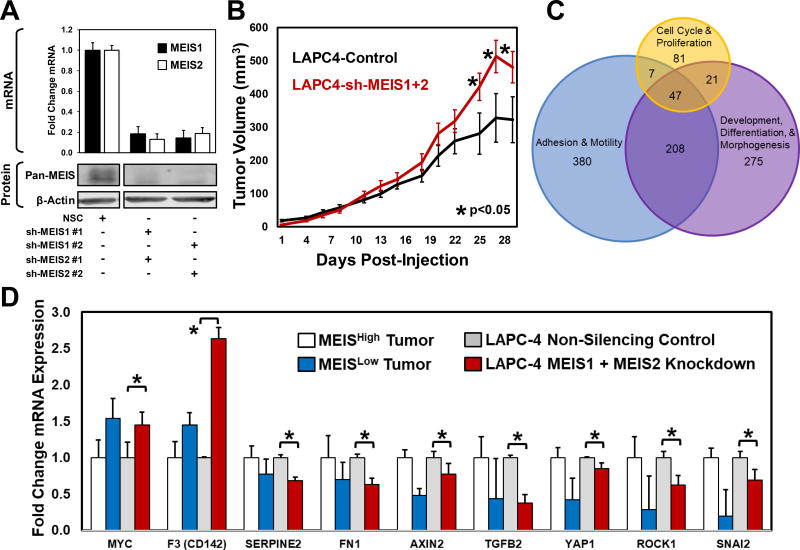
Figure 4. Functional Characterization of Total MEIS Knockdown LAPC-4 Cells.
(A) Assessment of MEIS1 and MEIS2 knockdown in LAPC-4 cell using RT-PCR (top) and Western blot analysis (bottom). Two shRNA constructs against MEIS1 and two shRNA constructs against MEIS2 were utilized to control for off-target effects. To determine MEIS1 and MEIS2 protein levels after shRNA depletion, western blot analyses was conducted using a mouse monoclonal targeting both MEIS1 and MEIS2 (Pan-MEIS).
(B) Xenograft growth of MEIS1 and MEIS2 double knockdown LAPC-4 cells injected subcutaneously on the flanks of hormonally-intact male nude mice compared to non-silencing controls. Differences in tumor volumes at days 25, 27 and 29 post-injection were statistically significant (Control N=8; double knockdown N=8; * p-value <0.05).
(C) Venn Diagram of MEIS-associated genes prioritized using Gene Set Enrichment Analysis (GSEA) leading edge analyses. The GSEA leading edge analyses identifies genes that potentially drive a phenotype, and are consistently at the “leading edge” of multiple pathway categories. This analysis was performed on pathways associated with Cell Cycle and Proliferation; Adhesion and Motility; and Development, Differentiation and Morphogenesis, and leading edge genes common to all three were identified (n=47). A heatmap demonstrating differential expression of these 47 genes is shown in Supplemental Figure 3B.
(D) Quantitative real-time PCR mRNA analyses analysis of candidates using cDNA of MEIS1 and MEIS2 double knockdown LAPC-4 cells compared to non-silencing controls. Data represents mean and SEM of experiments conducted in triplicate (* p-value <0.05). The fold change in mRNA expression within LAPC-4 cells with MEIS depletion is graphed next to the fold change in expression between MEISHigh vs. MEISLow tumors, which was statistically tested using RNA-seq analyses platforms to identify differentially-expressed genes.

