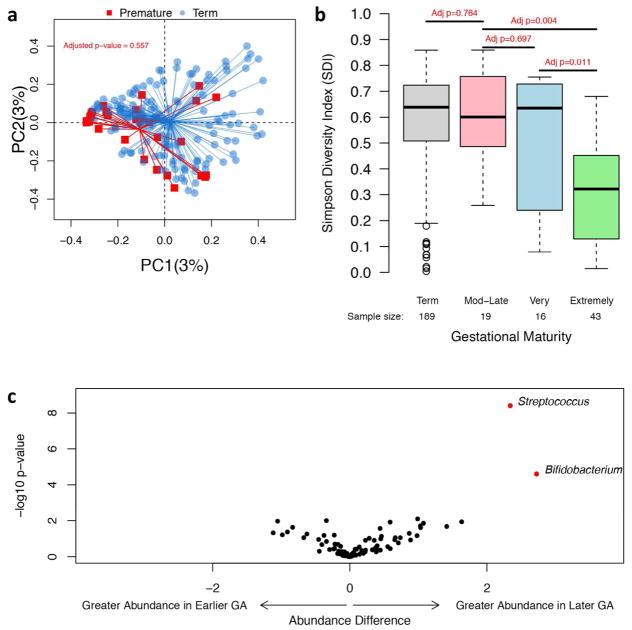
Figure 3. Bacterial phylogenetic relatedness differences between term and premature infants at 6 weeks of age (a), and bacterial alpha-diversity differences based on gestational maturity (b) and bacterial abundance differences between infants born at an earlier or later gestational age (c).
(a) Principal Coordinates Analysis plot showing bacterial phylogenetic relatedness differences between 6-week stool samples from premature (red) and term infants (blue). P-value is adjusted for exposures. PC1 = principal coordinate 1, PC2 = principal coordinate 2. Percentage refers to percentage of variance explained by the principal coordinate. (b) The bacterial alpha-diversity (SDI) of infant stool samples is indicated on the y-axis. P-value is adjusted for exposures and age (day of life). Infants are divided into groups based on gestational age at birth. Term is infants born at ≥37 weeks of gestation, moderate-late (Mod-Late) preterm infants are born at ≥32 weeks of gestation but <37 weeks, very preterm infants are born between 28 and <32 weeks of gestation, and extremely preterm infants are born between 24 and <28 weeks of gestation. Number of stool samples for each group is noted. However, exposure data for infants was occasionally not available, so number of samples evaluated for the adjusted analyses may be lower. (c) Bacterial taxa were evaluated for differences in abundance between infants born at a later compared to earlier gestational age at birth after with adjustment for exposures and age (day of life). On the x-axis, an abundance difference of greater than zero indicates that the bacterial taxon is found in greater abundance in infants born at a later gestational age (GA ≥32 weeks), while an abundance difference of less than zero indicates that the taxa is found in greater abundance in infants born at an earlier gestational age (GA <32 weeks). On the y-axis is the −log10 of the p-value for the abundance difference. A greater −log10 of the p-value indicates a more significant p-value. Red circles indicate taxa whose abundance difference is significant (p-value is <0.05) after adjusting for multiple comparisons.

