Figure 3.
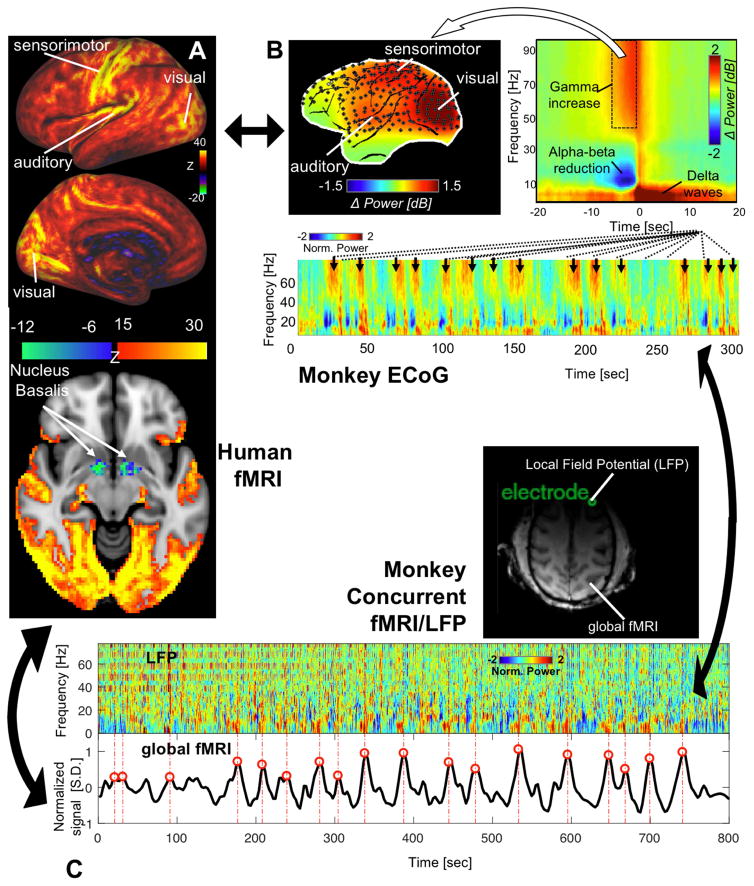
Global rsfMRI co-activation pattern (CAP) and sequential spectral transition (SST) electrophysiological events observed in three independent datasets. (A) The global CAP, derived from the Human Connectome Project (HCP) data by averaging the spatial pattern of time points showing the highest 16.6% global signals, shows widespread but sensory-dominant co-activations (top). Interestingly, this nearly whole-brain co-activation is associated with opposite de-activations in subcortical arousal-promoting regions, including the Nucleus Basalis (NB) at the basal forebrain (bottom), adapted from (Liu et al., 2018). (B) The global mean spectrogram of 128-channel electrocorticography (ECoG) recordings from monkeys during light sleep shows a characteristic SST event that occurs repeatedly (black arrows in the bottom panel). The averaged time-frequency pattern of SST (top right) indicates sequential power changes in three distinct frequency bands, among which the gamma-band (42–87 Hz) power increase at the SST is widespread but show highest amplitude at sensory regions (top left). (C) Local field potential (LFP) recorded by a single electrode in a macaque’s frontal cortex shows recurring SST events (top), each of which is followed by a peak in the global fMRI signal (red lines and circles, bottom) measured concurrently.

