
Fig. 6.
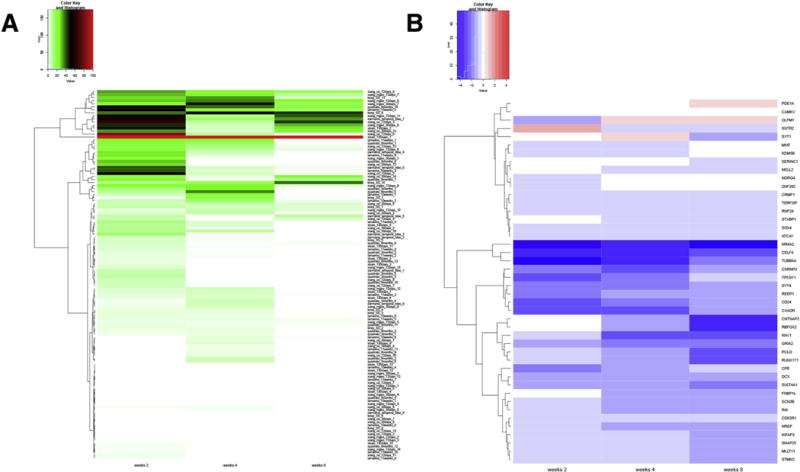
EGSEA comparison between different organotypic models. (A) Heatmap of EGSEA using genes found to be differentially expressed after rotenone treatment at the three time points and with the single-cell RNA-Seq derived gene sets. The significance score (from 0 to 100) is shown for each geneset, using a color palette from green to red. The geneset associated with the highest overall score across the three time-points is sloan_130days_1. (B) Log2 fold changes for the genes found in the sloan_130days_1 geneset are represented for the three time-points, with blue corresponding to down-regulated genes after rotenone treatment, and red color used for up-regulated genes. The most down-regulated gene at all time-points was NR4A2, an important transcription factor implicated in the differentiation of dopaminergic neurons. (For interpretation of the references to color in this figure legend, the reader is referred to the web version of this article.)