
Fig. 7.
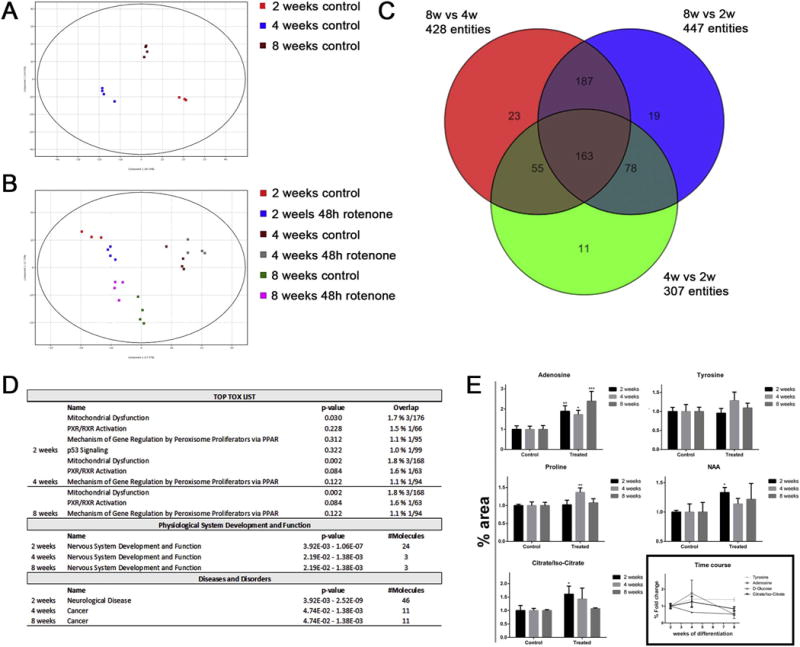
Alteration in extracellular metabolite levels after treatment of BrainSpheres with 5 μM rotenone. Extracellular metabolites were extracted from the media after 48 h rotenone treatment at 2, 4 and 8 weeks differentiation of BrainSpheres. A) PCA plot showing the profile differences between 2, 4 and 8 weeks control (untreated) BrainSpheres. B) PCA plot including data for 48 h rotenone treatment. C) Venn diagram showing the number of significantly changed extracellular metabolites at 2w vs 4w vs 8w. D) Ingenuity top tox list pathways, physiological system development and function pathways and disease and disorders pathways modified after rotenone exposure at different time points. E) Data for targeted metabolomics analysis of some metabolites, as a validation of untargeted results. Bars in 6E represent mean ± SD (n = 3). Asterisks indicate p-values from two-way ANOVA multiple test (p < 0.01 = *; p < 0.001 = **: p < 0.0001 = ***).