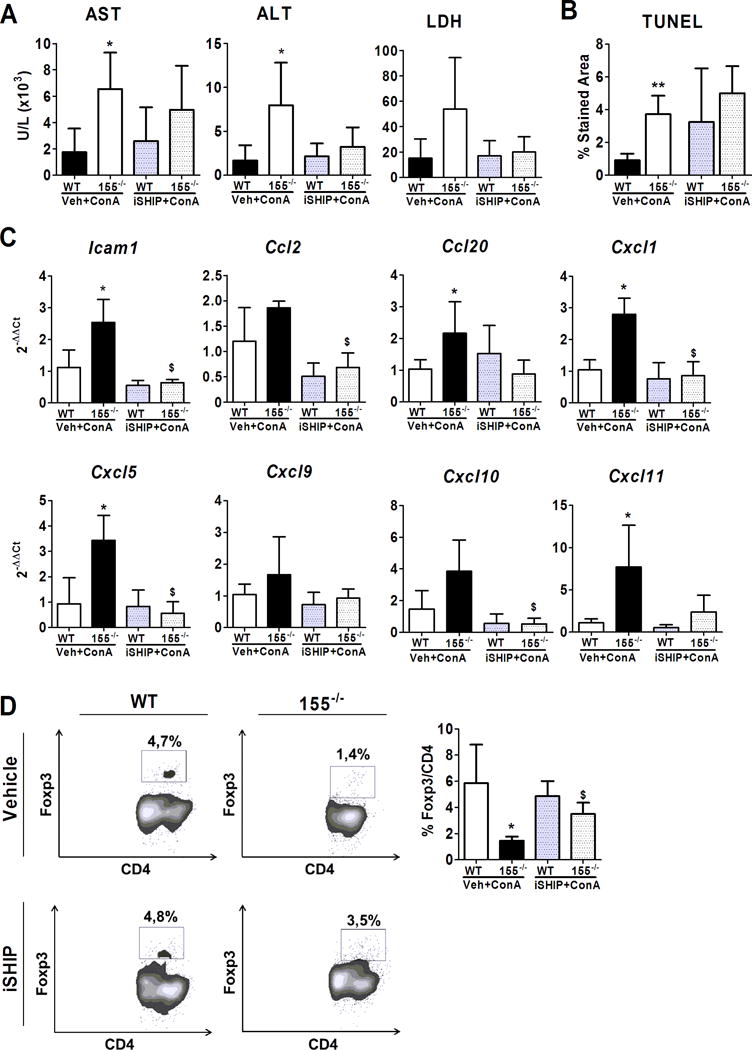
Figure 4. Inhibition of SHIP1 in miR-155 deficient mice.

WT and miR-155−/− mice were treated with SHIP1 inhibitor (iSHIP) (WT, n=5; miR-155−/−, n=4) or with vehicle (WT, n=5; miR-155−/− n=4) during 2 days followed by 10 mg/Kg ConA treatment. Mice were analyzed after 18 hours. (A) Level of liver transaminases and LDH in serum. (B) Quantification of TUNEL staining. (C) Gene expression of several inflammatory mediators and cytokines in liver tissue assessed by qPCR and expressed as 2−ΔΔCt fold change respect to WT-vehicle plus ConA treated animals. (D) Liver recruitment of CD4+ Foxp3+ cells was analyzed by flow cytometry. Flow cytometry plots show representative CD4+ Foxp3+ staining. Graph shows mean values for CD4+ Foxp3+ quantification. Significant p values are shown above the bars: *p<0.05 respect to WT-vehicle plus ConA treated animals; $ p<0.05 respect to miR-155−/− vehicle plus ConA treated animals.
