Fig. 2.

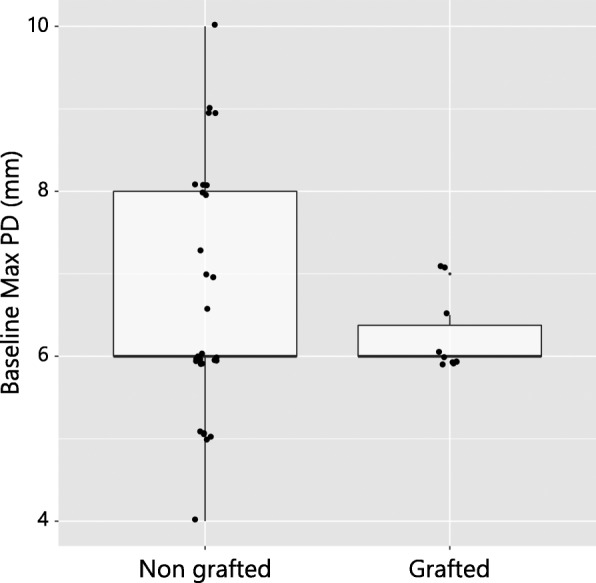
Box plot depicting no significant differences of the baseline maximum PD values between the grafted and non-grafted patient groups (p = 0.353)

Box plot depicting no significant differences of the baseline maximum PD values between the grafted and non-grafted patient groups (p = 0.353)