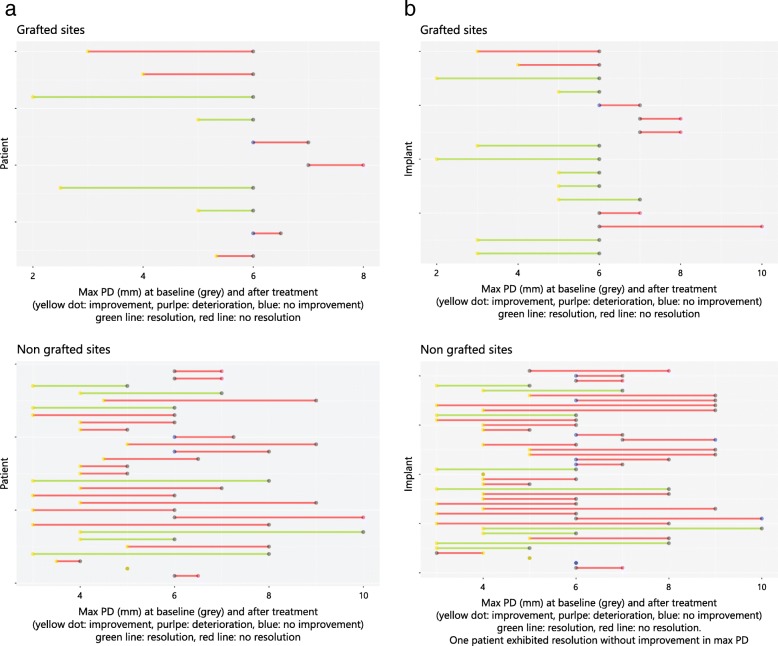
Fig. 3.
Dumbbell—dot plots illustrating (a) disease resolution and no resolution at non-grafted and grafted sites at the patient level analysis with no significant difference between the two groups (p = 0.579). Patents with improvement, deterioration, and no improvement following the treatment based on the max PD changes are depicted; (b) disease resolution and no resolution at the implants in non-grafted and grafted sites. Significantly higher disease resolution in the grafted implant group (p = 0.048)

