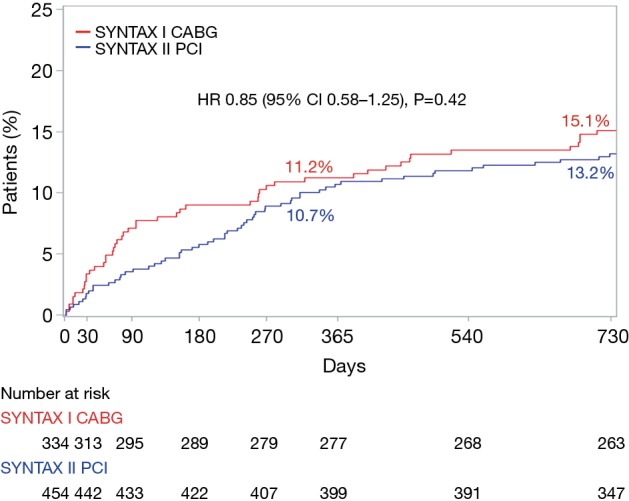
Figure 5.

Two-year clinical outcomes among the study patients, compared with the equipoise-derived SYNTAX I CABG cohort—exploratory analysis. Kaplan-Meier curves are shown for the SYNTAX II group (blue) and the surgical revascularization arm of the original SYNTAX I trial (red) for the major adverse cardiac or cerebrovascular events (MACCE). Presentation of SYNTAX II 2-year results at EuroPCR 2018, Paris, France.
