
Figure 4.
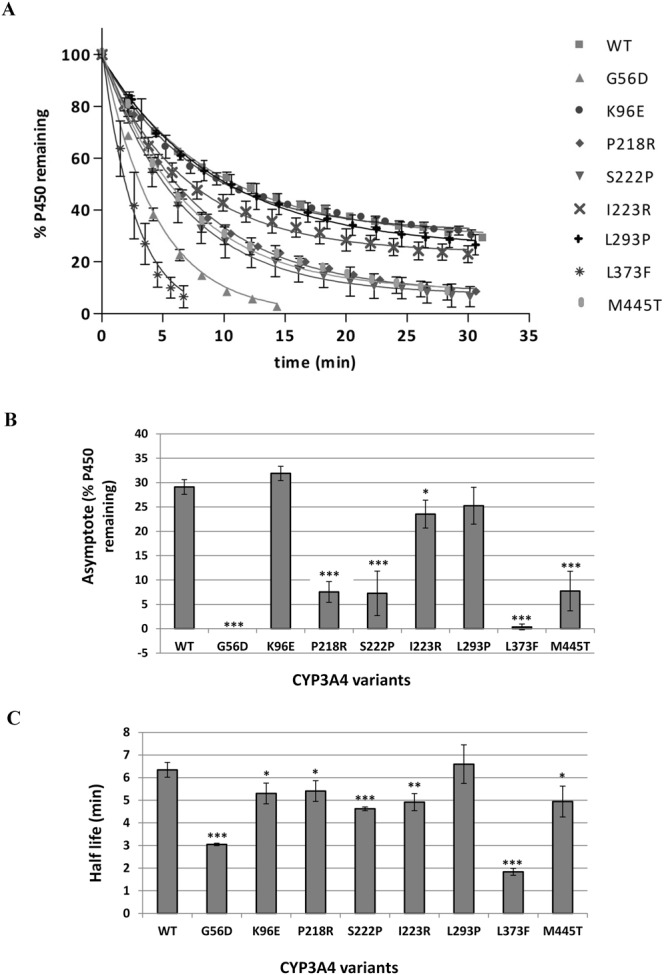
Thermostability of CYP3A4 polymorphic variants at 34 °C. (A) Graphs showing the decrease in P450 content at 34 °C over 30 minutes. A one phase exponential decay model was fitted to the data using non-linear regression as described in Methods. (B) Comparison of % P450 remaining when the graph reached a low plateau for each variant. (C) Comparison of the half-life of each variant at 34 °C. Error bars represent the standard deviation of three replicates. Student t-test was used to determine values significantly different from WT: *P < 0.05, **P < 0.01, ***P < 0.005.